SPX 0DTE Options Volume Analysis: Predict Market Direction Before Price Confirms
Have you ever wondered why some trading days exhibit smooth, directional price action while others trap you in frustrating back-and-forth chop?
What if the answer isn’t found solely on your price chart but rather hidden in the flow of SPX 0DTE options volume throughout the trading session?

Table of Contents
The Power of SPX Options Volume Analysis
By analyzing SPX 0DTE options volume, you can unlock intraday market sentiment in real-time. More specifically, measuring how call and put speculators are transacting throughout the trading session can reveal three key advantages for your trading:
- Character of price action (choppy vs. trending)
- Projected path of price through the end of the trading session
- Key levels where reversals are likely to occur (or fail)
And the best part of SPX 0DTE options volume analysis is that we’ve built specific tools to analyze (and more importantly) make actionable this intraday volume.
While many traders rely on price-based indicators that lag behind market reality, our Intraday Volume Analysis tools let you see what’s happening under the hood of the market right now, allowing you to adjust your strategy as conditions change.
For example in SPX 0DTE options trading:
- When call speculators target progressively higher strikes throughout the session, that’s the signature of a trending day higher
- When call speculation trends lower while put speculation trends higher, you’re likely in for a choppy, range-bound session
GammaEdge's Evolution of SPX 0DTE Volume Analysis
As we started down the path of Volume Analysis, we naturally began at a higher-level and then got more granular as our understanding increased; we didn’t know what we didn’t know.
This led us to develop our first volume analysis tool: $volu.
$volu: The Foundation of Volume Analysis
The $volu command measures option volume for the current trading session by strike and by expiration. Think of it as a snapshot of where all options activity is taking place across the entire SPX options chain.
To use this command, simply type $volu spx in the Discord command line. This produces a visualization showing call and put volume distribution across all strikes and expirations.
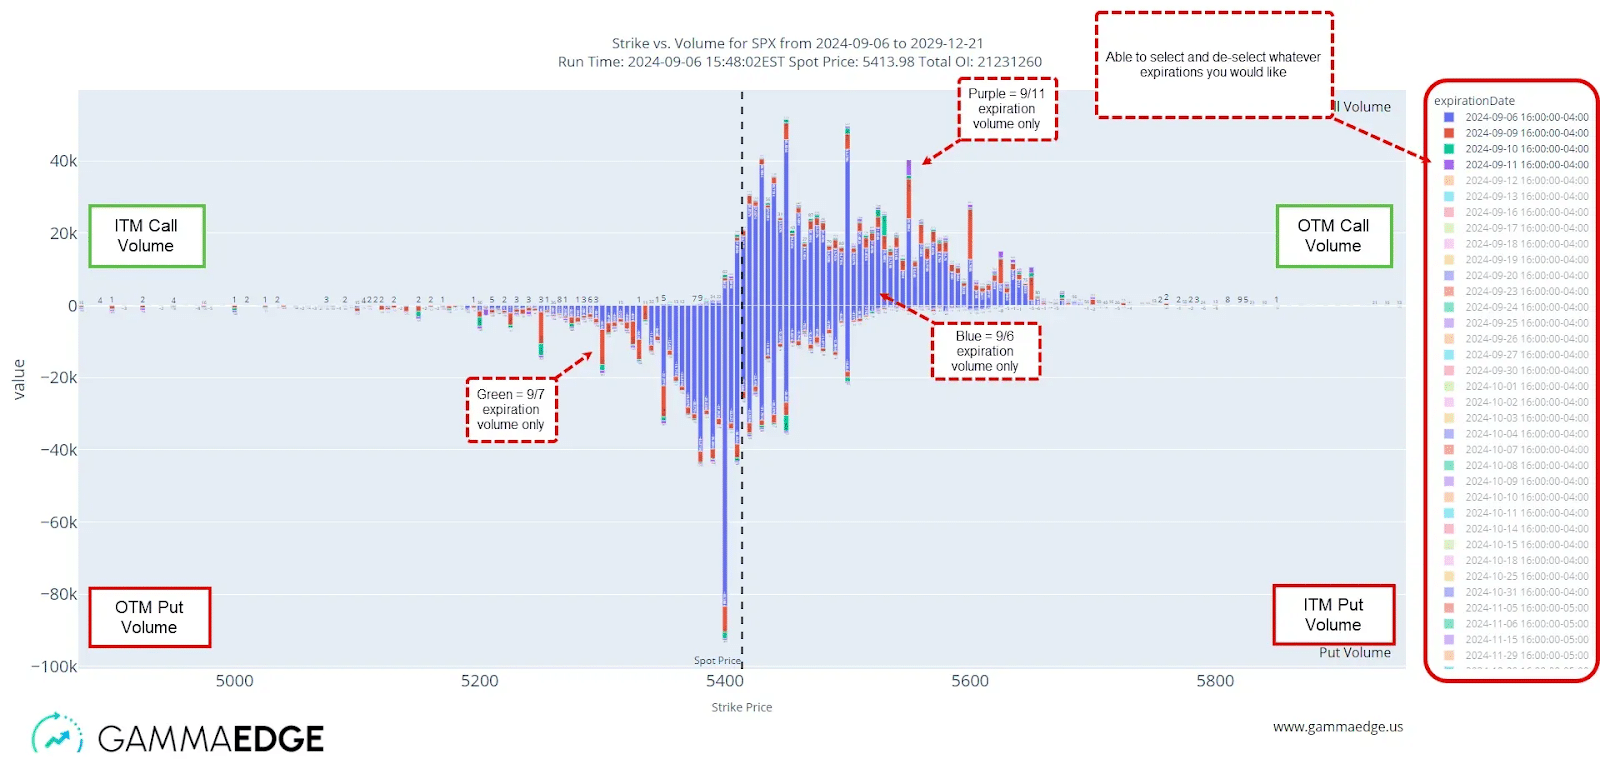
How To Read The SPX Options Volume Chart:
- Black dashed line: Spot price at the time the chart was run
- Above the 0 line: Call volume (positive values)
- Below the 0 line: Put volume (negative values)
- Left of spot price: OTM Puts (below 0) and ITM Calls (above 0)
- Right of spot price: ITM Puts (below 0) and OTM Calls (above 0)
NOTE: The chart is dynamic, which gives you the ability to select specific expirations to focus on, allowing you to isolate activity for particular dates.
Practical Application of SPX Options Volume Analysis
While $volu gives us a comprehensive view of all SPX options activity, its true power lies in unlocking for you:
- Key Levels of Reference: Understand which strikes are attracting volume and whether this focus is shifting higher or lower as the session progresses
- Time Horizon Insights: Detect if significant volume exists beyond the 0DTE expiration, which helps distinguish one-day moves from potentially larger trends
As a starting point each morning, we use the Web App Dashboard for understanding key levels derived from the SPX options market. However, once the opening bell rings, the $volu command becomes essential for tracking where intraday volume is flowing in real-time.
For example:
- If you see price moving higher during the session and simultaneously observe increasing OTM call volume at strikes above current price, this confirms bullish sentiment and suggests further upside potential.
- As the session progresses, large volume concentrations at specific strikes often form natural “goal posts” for where price might gravitate toward by session end.
- Pay special attention to activity beyond 0DTE – significant volume in further dated expirations often indicates market participants expect the current move to continue, while volume concentrated solely in 0DTE usually signals a one-day phenomenon.
This forward-looking perspective is crucial – we always emphasize skating to where the puck is going, not where it is.
While analyzing the $volu output, we realized that a significant amount of SPX was transacting in the 0DTE contract (40-60%). This concentration meant we needed to develop more specialized tools to understand this specific contract expiration for intraday trading.
All Things $vold
Building on what we unlocked with $volu, we needed a tool to specifically track how SPX 0DTE options volume by strike was changing throughout the session. This led to developing $vold (VOLume Differential).
$vold displays SPX 0DTE options volume in 5-minute slices throughout the trading session and offers two key pieces of information:
- Which strikes are attracting SPX options volume during specific periods of the session
- How this SPX 0DTE options volume distribution changes over time as market sentiment evolves
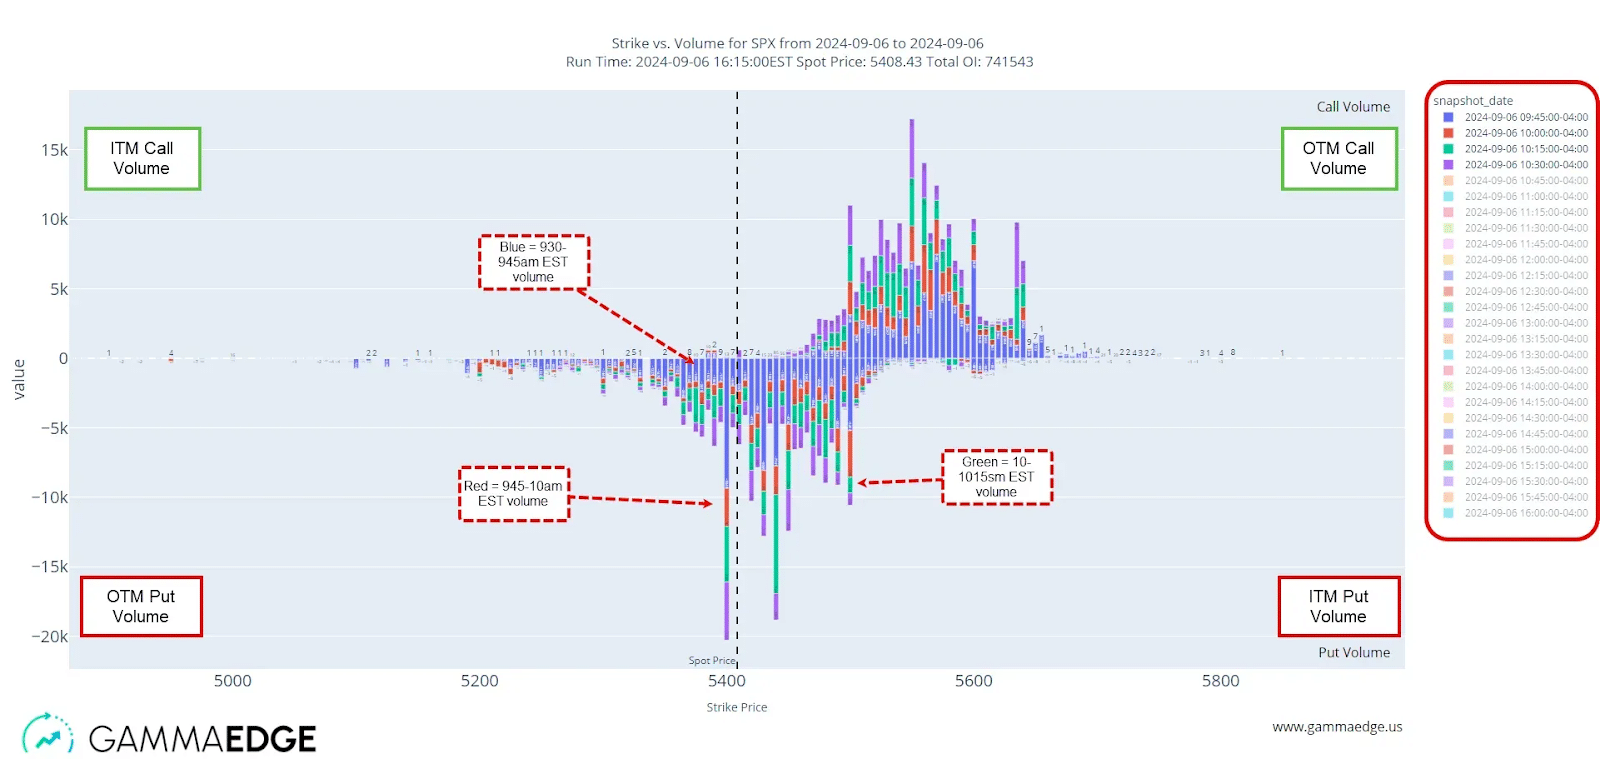
Key Features
- 0DTE Focus: Exclusively tracks the expiration where most price-moving activity occurs
- Time Slice Comparison: See how volume distribution changes from one period to the next (i.e., over 5-minute increments throughout the trading session)
- Interactive Timeline: Cycle through the trading day to observe evolving sentiment (the output is dynamic like $volu)
- Granular Analysis: Pinpoint exactly when significant volume begins targeting specific strikes
Practical Applications
The $vold command transforms how you approach intraday trading by revealing:
- Trend Identification: Spot emerging trends in option activity (which we’ve found price generally follows)– is speculation moving higher, lower, or unchanged throughout the session?
- Volume Shift Analysis: Identify when traders begin targeting different strikes, often preceding price movement
- Key Level Formation: Watch in real-time as certain strikes gain importance through accumulated volume
- Intraday Reversals: Detect when volume patterns change direction, suggesting potential price reversal
When combined with price action, $vold reveals the “why” behind price movements. For example, if price suddenly rallies, $vold will show whether the move is supported by increasing call volume at higher strikes (suggesting continuation) or if volume remains concentrated at lower strikes (suggesting limited upside).
What traders quickly notice when using $vold is that certain patterns emerge in how call and put volume shifts throughout the session. On trending days, volume consistently targets strikes in the direction of the trend. On choppy days, volume oscillates between calls and puts without meaningful expansion higher or lower.
This observation led to our most powerful tool: $volm, which takes the data from $vold and transforms it into a visualization that instantly reveals the character of the trading day and where price could likely be headed.
All Things $volm: The Ultimate SPX 0DTE Options Volume Momentum Tool
After developing $vold to track SPX 0DTE options volume in 5-minute slices, we realized we needed a more intuitive way to visualize how call and put sentiment shifts throughout the session. This led to the development of $volm (VOLume Momentum) – our most powerful intraday SPX options volume analysis tool.
The $volm command transforms the raw SPX 0DTE options volume data from $vold into a visualization that immediately reveals the character of the trading day.
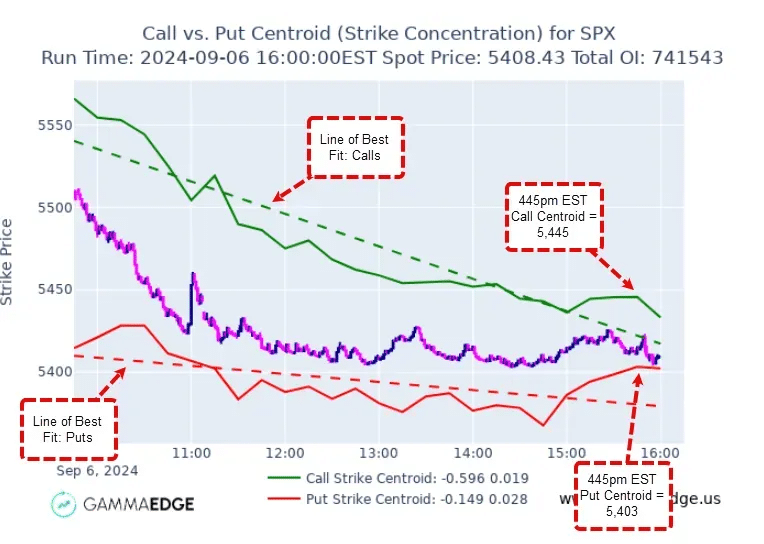
In addition to the centroids, the $volm visual also plots our “lines of best fit” (dashed lines) that project the trend of these centroids to the trading close, giving you probable price targets for the session.
Said another way, if we know how speculators have acted/transacted from the open through any specific point in time during the trading session, assuming all else equal, we can then logically project out how those centroids will continue through the remainder of the session (like shown in the example below).
Using $volm In Your Trading
To reinforce this point, $volm is a measurement of market sentiment in the moment as reflected through SPX 0DTE options volume traded by strike, which we then plot throughout the session via the centroids.
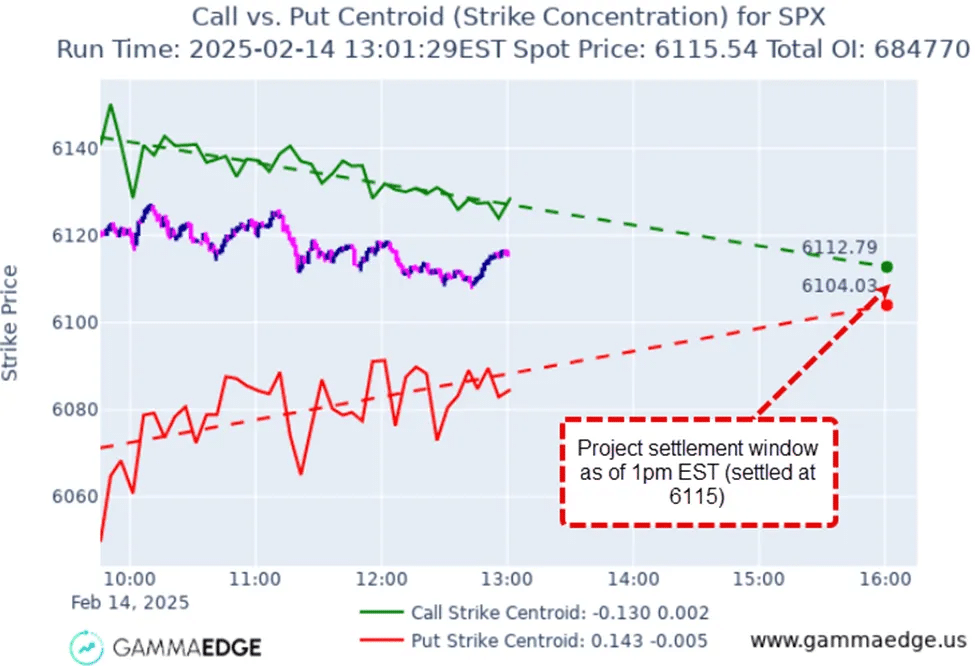
It’s important to note that SPX options volume analysis is not a predictor of price. However, we can utilize the ‘lines of best fit’ to show where price could finish assuming the market continues to do what it has been doing in terms of transacting at specific strikes as measured by the SPX 0DTE options centroids.
This ‘line of best fit’ is a linear regression utilizing the 5-minute SPX options centroid values through that point in time. This line shifts throughout the session as the centroid values change.
Assuming all things equal, if we know where spot price could finish the session based on SPX 0DTE options volume, this knowledge can then be used to inform potential trade ideas. Said another way, if the market continues to target the same strikes it has been (via the SPX options centroids), then we know the goal posts of where spot price could finish the session.
However, this is not the only use of SPX 0DTE options $volm analysis. Another key use is it can provide us with an understanding as to the character of the trading session, in terms of a chop day vs. a trending day in SPX options.
Pro-Tip: Pay attention to the action of the Cumulative Tick via the Market Trend Model and the SPX 0DTE options $volm command. They often show intraday confluence with each other.
The Four Key SPX 0DTE Options Volume Patterns
What makes SPX options $volm analysis so powerful is its ability to immediately reveal the character of the trading day in terms of chop vs. trending. There are four primary SPX 0DTE options volume patterns that consistently appear:
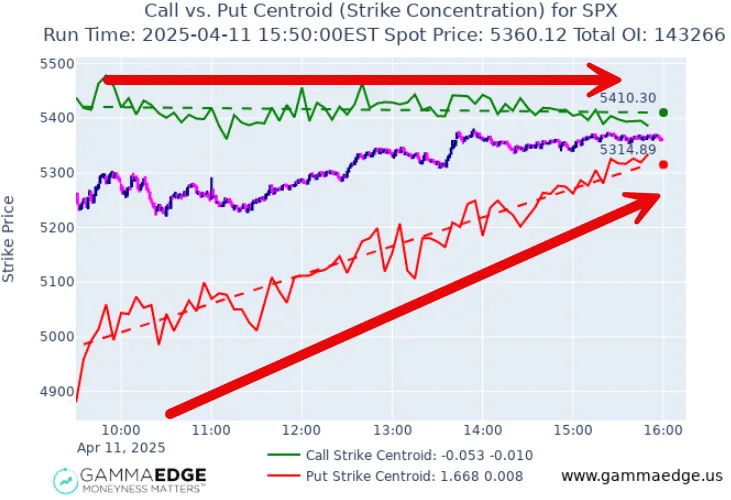
Scenario 1: Call and Put Centroids Trending Higher
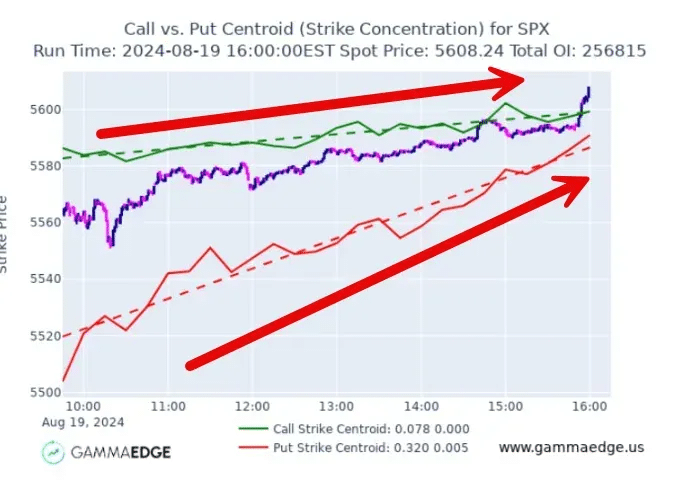
What it looks like:
- Call centroids progressively targeting higher strikes
- Put centroids also moving higher throughout the session
- Dashed lines (lines of best fit) showing clear upward slopes
- Price advancing higher, confirming the call and put centroid movements and slopes of the best fit lines
What it means:
- Strong bullish momentum
- Put speculators likely closing positions as price rises
- Call speculators aggressively targeting higher strikes
- Typically produces a trending day higher
Trading implications:
- Prioritize long-biased trades
- Look for pullbacks to enter in the direction of the trend
- Avoid shorting against this strong upward momentum
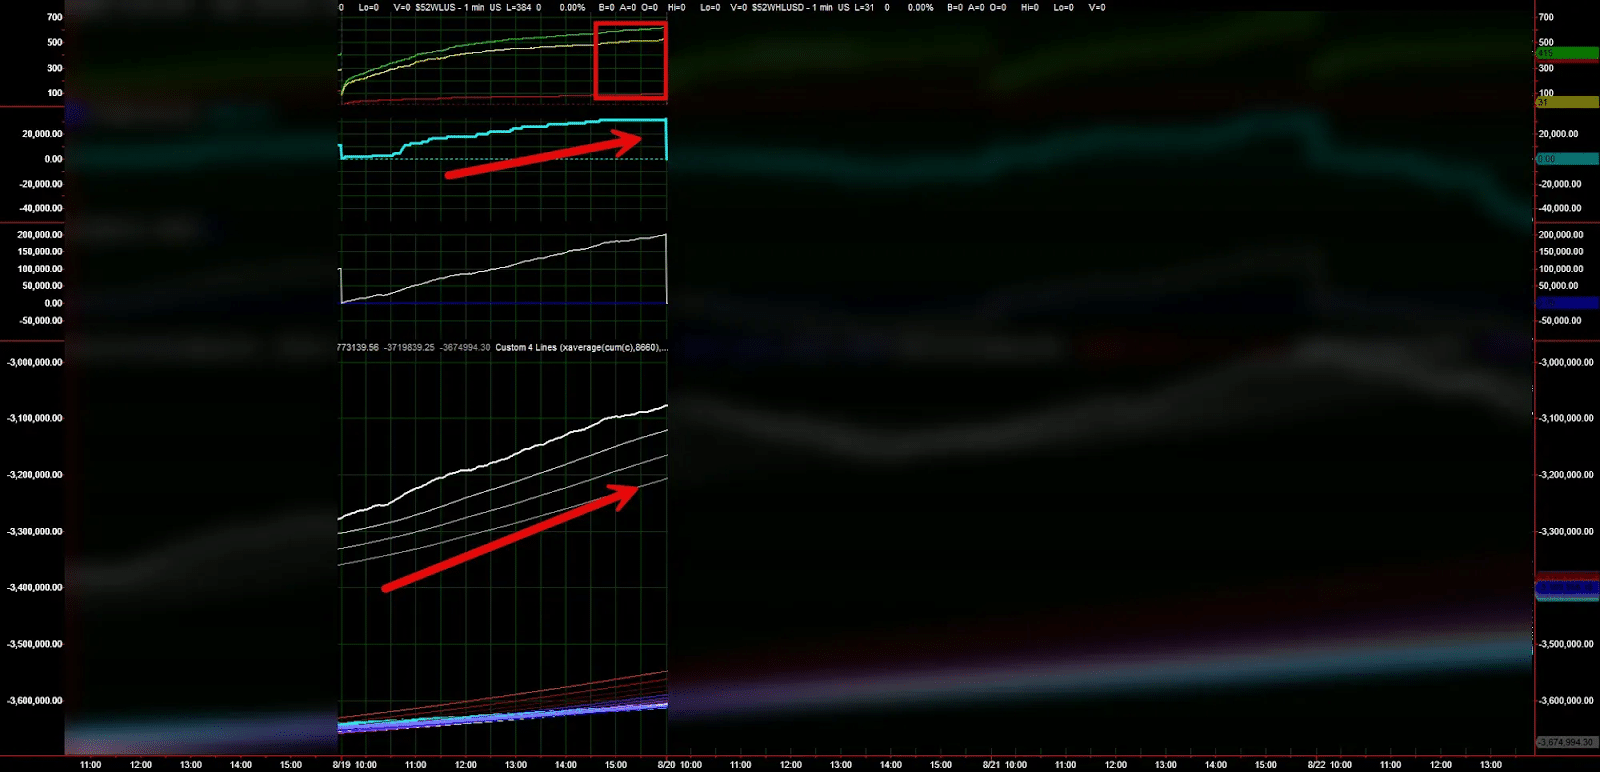
Pro-Tip: Here is an example of using the $volm command with the Market Trend Model (from the same day). We can see powerful confluence between the Cumulative & Filtered Tick trending higher along with the call & put centroids.
Scenario 2: Put Centroids Flat, Call Centroids Trending Lower
What it looks like:
- Call centroids gradually targeting lower strikes
- Put centroids showing minimal change in targeting
- Call line of best fit has negative slope; put line relatively flat
What it means:
- Weakening bullish sentiment
- Call speculators becoming less aggressive
- Puts maintaining position rather than pressing advantage
- Often produces sideways to lower price action
Trading implications:
- Bias slightly to the short side
- Expect choppy, range-bound conditions
- Consider reducing position size due to lower directional clarity
Scenario 3: Call and Put Centroids Trending Lower
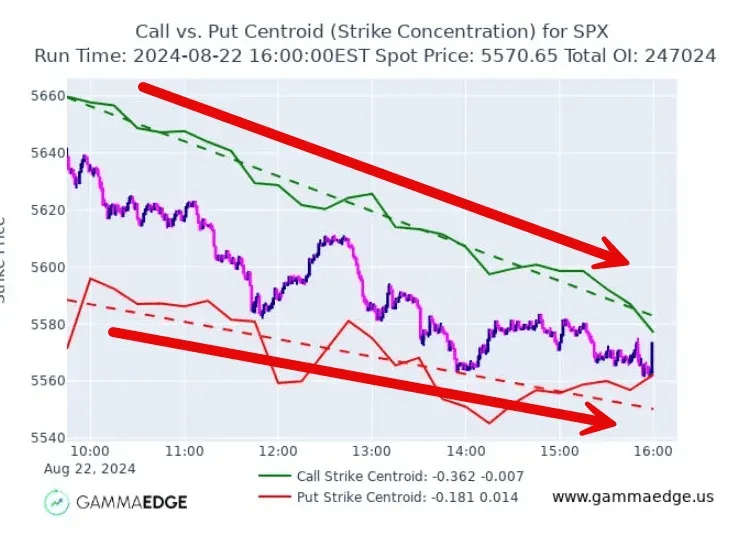
What it looks like:
- Call centroids progressively targeting lower strikes
- Put centroids also moving lower throughout the session
- Both lines of best fit showing clear downward slopes
What it means:
- Strong bearish momentum
- Call speculators likely closing positions as price falls
- Put speculators aggressively targeting lower strikes
- Typically produces a trending day lower
Trading implications:
- Prioritize short-biased trades
- Look for bounces to enter in the direction of the trend
- Avoid trying to catch bottoms against this momentum
Scenario 4: Call Centroids Flat, Put Centroids Trending Higher
What it looks like:
- Put centroids gradually targeting higher strikes
- Call centroids showing minimal change in targeting
- Put line of best fit has positive slope; call line relatively flat
What it means:
- Weakening bearish sentiment
- Put speculators becoming less aggressive
- Calls maintaining position rather than pressing advantage
- Often produces sideways to higher price action
Trading implications:
- Bias slightly to the long side
- Expect choppy, range-bound conditions
- Consider reducing position size due to lower directional clarity
Intraday Reversal
In addition to the 4 SPX options $volm states above, it’s also incredibly useful for showing us when structure is changing in SPX 0DTE options.
Take a real example from 09/11/24. In the morning session, both call and put SPX 0DTE options centroids were trending lower, indicating bearish momentum (this aligned with the Cumulative Tick, which was also trending lower through 11am EST).
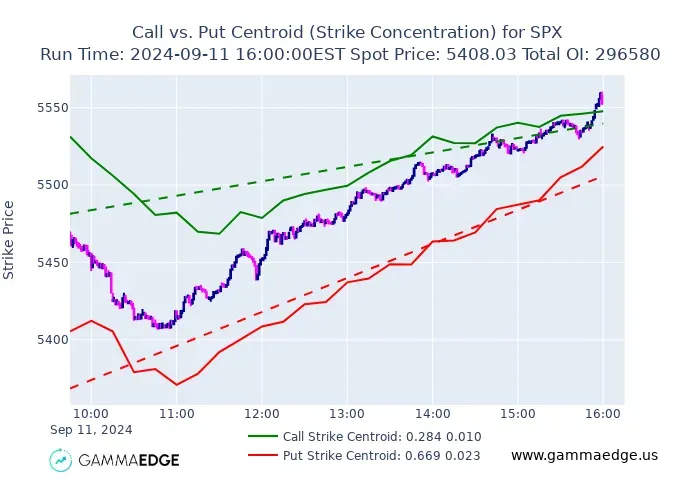
Around 11am EST, something critical happened – both indicators began to reverse — the Cumulative Tick started trending higher, and simultaneously, the $volm centroids began to shift direction.
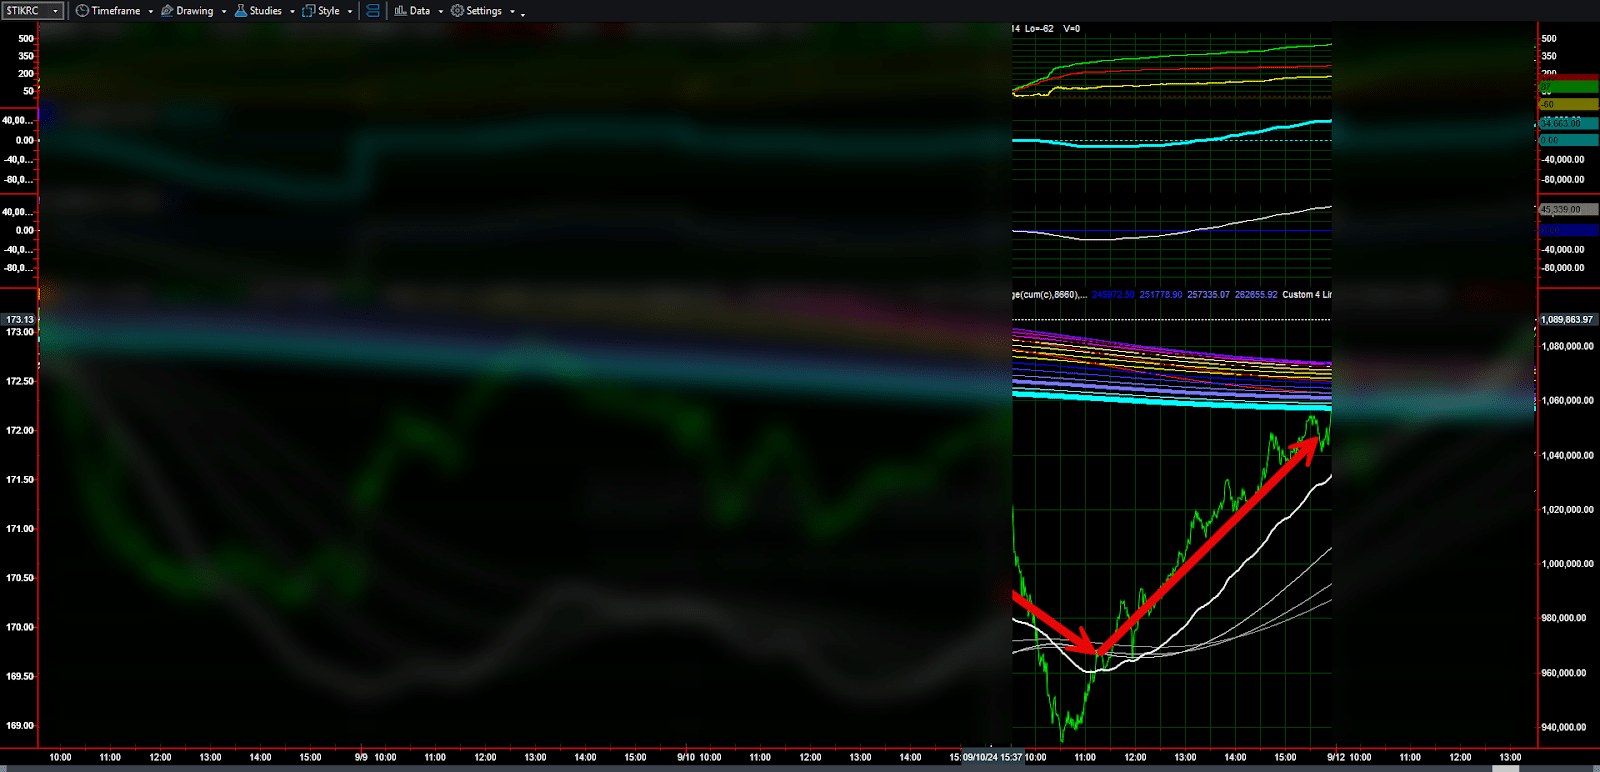
This confluence provided a powerful signal that the morning’s bearish trend was reversing – giving traders confidence to flip from short to long positions.
What makes this example so instructive is the timing – both the Cumulative Tick and $volm centroids shifted together, providing multiple confirmations of the changing market character. While price action remained choppy during this transition, these tools clearly signaled the underlying shift in sentiment.
By tracking this evolving sentiment through the centroids, traders could anticipate the afternoon’s bullish price action well before it fully materialized on the price chart.
SPX 0DTE Options Volume Rules of Thumb
Through extensive testing and observation, we’ve developed several key guidelines for using $volm effectively:
- Price respects centroids: In general, price does not violate the centroids except occasionally at the very end of a trading session. Said another way, spot price goes where targeting is occurring.
- Price follows speculation: Spot price tends to go where speculators are actively transacting – it rarely moves to levels where there’s no volume supporting it.
- Best reliability after 11:30 am EST: The London close often marks when patterns become more reliable, as the morning’s positioning settles into clearer trends.
SPX 0DTE Options Trading - Frequently Asked Questions
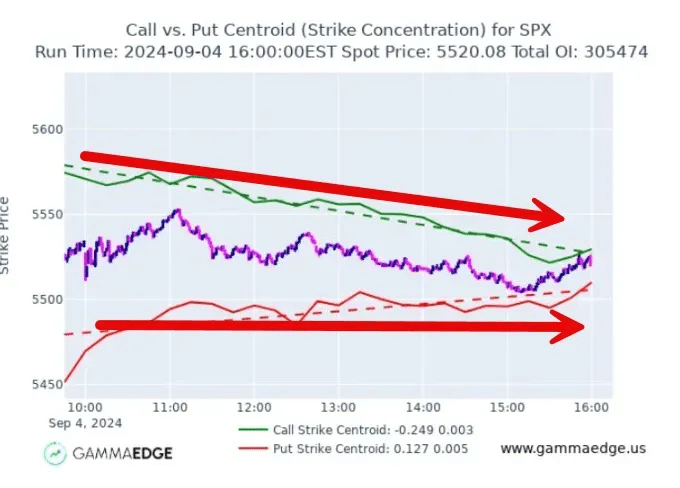
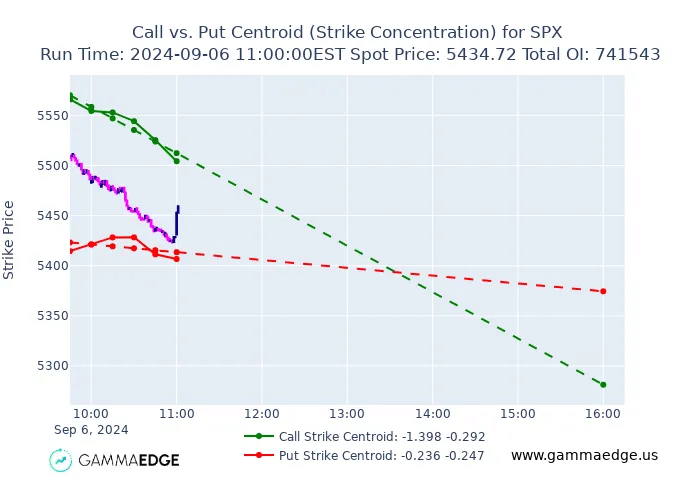
Q: What does it mean when the lines-of-best-fit are crossing?
This condition generally only happens in the morning. Remember, the lines of best fit are generated from the centroids themselves. Therefore, we need to have several centroids formed before the trends start to make better sense intraday. However, with the knowledge and examples we have discussed in this module, you should be able to understand what is happening.
Let’s take the example below. Here we can see the green (call) line of best fit is pointed well lower while the red (put) line of best fit is flat to slightly lower. What can we imply from this…? Calls are being closed much more aggressively than put are being opened, which would give us a sideways to lower bias.
Q: What does it mean when the centroids are above and below the lines of best fit?
Using the call side for this example, as the centroid line shifts above the line of best fit, this tells us the market intentions are moving higher from what they previously were. If the centroid is below the line of best fit, then this tells us the market intentions are shifting lower from where they previously had been throughout the session.
This same logic can be applied to the put side, but flipped.
Q: Can I use volume analysis on single stocks/ETFs?
We find it best to use this analysis on SPX given the majority of volume occurs at the 0DTE contract, as opposed to stocks/ETFs, which only offer weekly expirations.
Q: When is the $volm command most informative?
We find that this command works best after the London close, which is at 11:30am EST.
Summary: The Power of SPX 0DTE Options Volume Analysis
Through our progression from $volu to $vold and ultimately to $volm, we’ve developed a comprehensive system for understanding market sentiment in real-time through SPX 0DTE options volume.
Unlike conventional technical analysis that relies on lagging price patterns, our SPX options volume analysis tools let you see where options speculators are focusing their activity, giving you understanding of:
- The likely character of the trading day (trending vs. choppy) based on SPX 0DTE options volume
- Potential price targets based on SPX options speculator positioning
- Early warning signs of sentiment shifts in SPX 0DTE options
- Confirmation of other technical signals through SPX options analysis
By combining these SPX options tools with our Market Trend Model, you create a powerful system for identifying high-probability trade setups while avoiding low-probability environments.
Action Steps: Implementing This Today
Here’s how to start using volume analysis in your very next trading session:
- Run these commands throughout the session ($volu, $vold, $volm)
- Look for these key patterns:
- Both centroids trending higher: Bullish momentum
- Both centroids trending lower: Bearish momentum
- Centroids moving in opposite directions: Choppy conditions
- Combine with the Market Trend Model:
- Align your trades with both the Cumulative Tick and centroid direction
- When they confirm each other, increase position size
- When they conflict, reduce size or sit out
By adding SPX 0DTE options volume analysis to your trading toolkit, you’ll gain a significant edge in understanding market sentiment that most traders never see. Remember, price is the last thing to change – by tracking options volume, you’re seeing where the smart money is positioning before those moves appear on the price chart.