True Delta Zero and True Gamma Zero: Market Structure Indicators That Reveal When Big Moves Are Coming
Have you ever wondered when the market is about to make its next big move?
Yes, it’s great that we have charts, indicators, and technical patterns – but that stuff is only surface level. What if there’s a way to see the market’s underlying balance—or imbalance—that most people completely miss?
Today we’re diving into two powerful sentiment indicators that can help you understand when the market is primed for a major shift: true delta zero and true gamma zero.
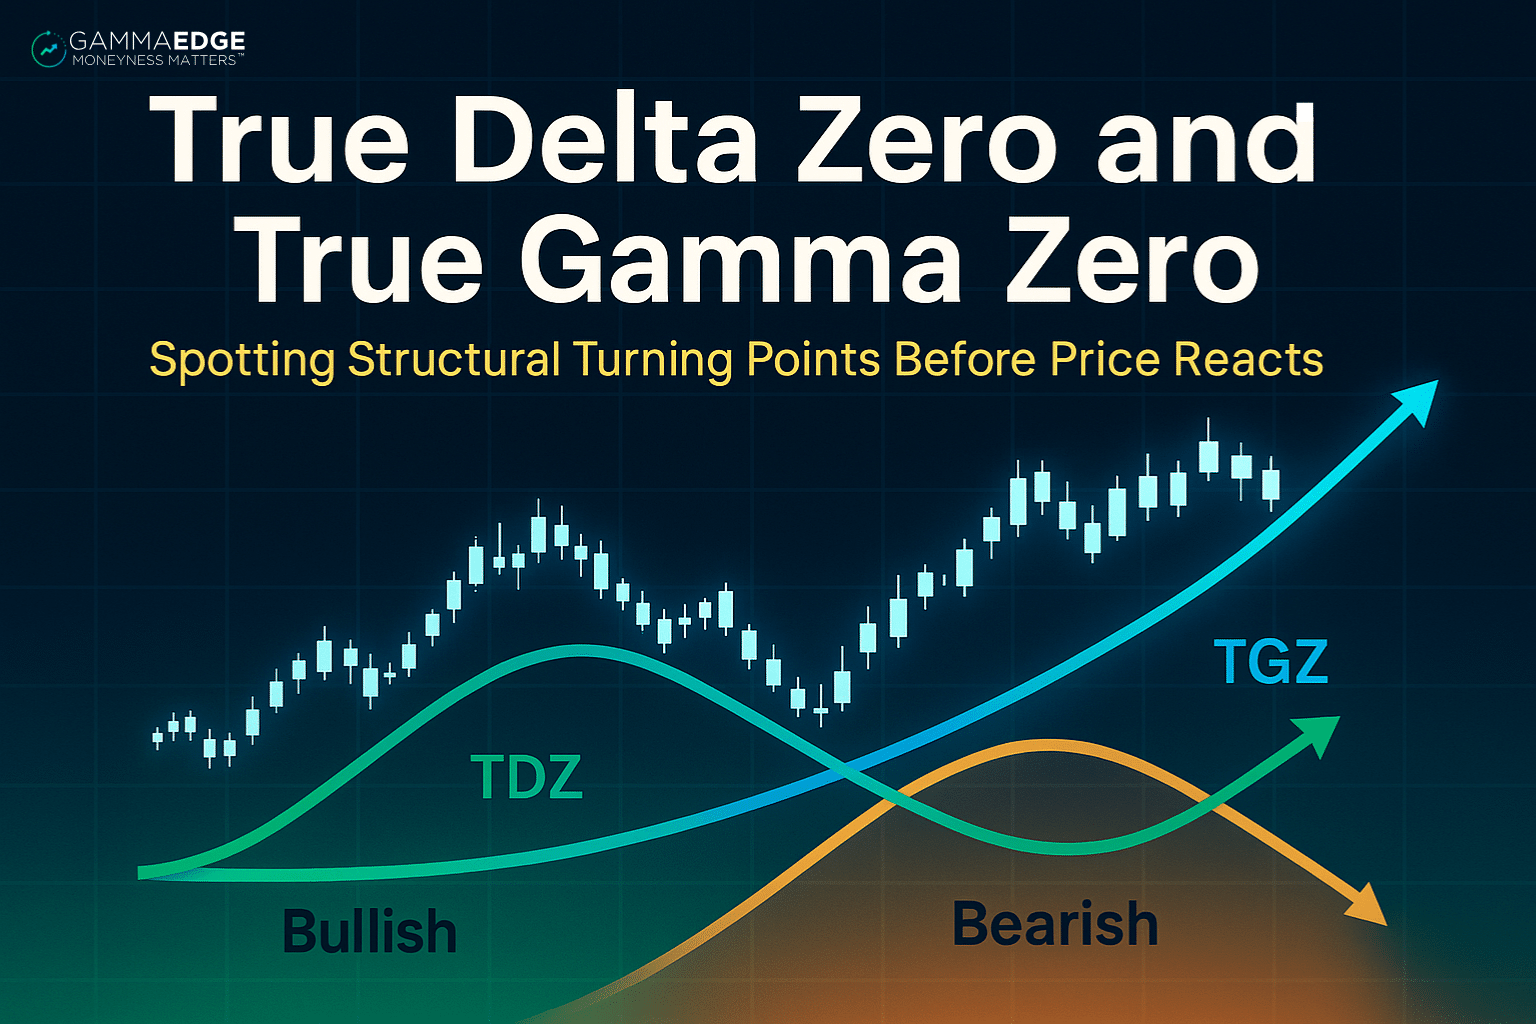
Table of Contents
Why Most Traders Miss the Structural Big Picture
Here’s what most traders miss: whether you’re trading stocks, futures, or options, today’s market is driven by options positioning. With the explosion of options trading across all participant types, dealers are managing massive exposure that directly impacts price movement.
If you’re only looking at traditional indicators, you’re missing a key driver of market trends (or lack thereof).
Think about it – dealers are constantly hedging risk across:
- Multiple expiration dates
- Hundreds of strike prices
- Both calls and puts
- Constantly shifting participant positioning
While you’re analyzing price charts and momentum indicators, there’s an entire layer of structural forces operating beneath the surface. That’s where true delta zero and true gamma zero indicators come
Understanding True Delta Zero and True Gamma Zero
Think of these as the market’s structural balance points that reveal dealer positioning across the entire options complex.
True Delta Zero (TDZ): The Delta Balance Point
True Delta Zero (TDZ) is the theoretical balance point where put delta and call delta are perfectly balanced across the entire options complex.
Key characteristics:
- Price invariant: Not driven by current price action
- Structural insight: Shows where dealer delta exposure transitions from net positive to net negative
- Forward-looking: Reveals positioning changes before they impact price
True Gamma Zero (TGZ): The Gamma Balance Point
True Gamma Zero (TGZ) represents the theoretical balance point where put gamma and call gamma are exactly balanced across the complete options structure.
Key characteristics:
- Price independent: Reflects structural positioning, not current market price
- Exposure tracking: Helps identify transitions in dealer gamma exposure
- Momentum indicator: Shows acceleration potential in either direction
The Critical Insight
When these delta and gamma zero levels start shifting from downtrends to uptrends, it suggests calls are increasing their influence within the options complex—exactly what you want to see for building bullish momentum.
Why True Delta Zero and True Gamma Zero Matter for Your Trading
Instead of getting lost in the complexity of individual options positions, true delta zero and true gamma zero give you a bird’s-eye view of structural positioning.
Reading Market Structure Through Zero Levels
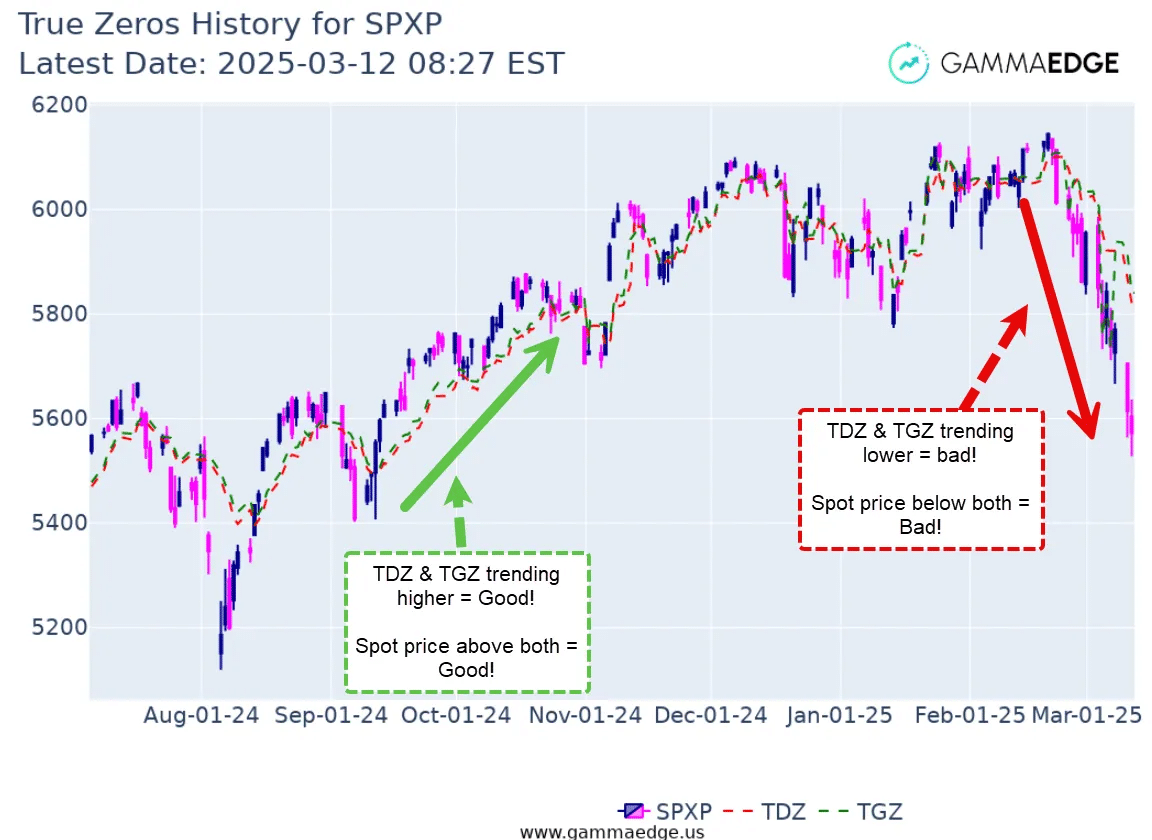
Bullish structural signals:
- Both true delta zero and true gamma zero trending higher
- Evidence of call-dominated options complex
- Dealer positioning supporting upward moves
Bearish structural signals:
- Both levels trending lower
- Growing put influence in the complex
- Structural headwinds for price advances
Warning signals:
- Divergence between true delta zero and true gamma zero trends and price action
- Early indication that structural positioning might not support current moves
The Real Power: Analyzing the Slopes
Here’s where true delta zero and true gamma zero analysis gets interesting. It’s not just about where these levels are—it’s about how they’re moving.
Slope Analysis for Market Direction
Bullish slope patterns:
- Both true delta zero and true gamma zero slopes trending higher together
- Indicates expansive, bullish environment
- Structural support for continued upward momentum
Bearish slope patterns:
- Both slopes flattening out or trending lower
- Signal that momentum may be shifting
- Structural support weakening
Divergence patterns:
- Price moving one direction while true delta zero and true gamma zero slopes move another
- Often provides early warning signals
- These divergences frequently resolve in meaningful price movements
Identifying Market Reset Signals
One of the most powerful applications of true delta zero and true gamma zero analysis is identifying when price interacts with these structural levels.
Price Interaction with Zero Levels
What to watch for:
- Price approaching or crossing through true delta zero and true gamma zero levels
- Market interacting with points of minimal dealer exposure
- How slopes respond to price interaction
Key observations:
- How price behaves around these levels reveals structural support/resistance
- Slope responses indicate whether positioning supports or challenges price action
- Significant moves above/below levels while slopes diverge often signal important shifts
Divergence Resolution Patterns
Powerful setup conditions:
- Price moves significantly above/below true delta zero and true gamma zero levels
- Slopes diverge from price action direction
- Structural positioning conflicts with price movement
- These divergences often resolve themselves in meaningful ways
Conclusion: Adding Structural Intelligence to Your Trading
True delta zero and true gamma zero provide a unique window into market structure that most traders completely ignore. While they won’t tell you exactly where the market is going, they reveal where the structural foundation is strongest or weakest, and when conditions may be ripe for significant moves.
The competitive advantage:
- See dealer positioning that affects all market participants
- Identify potential turning points before they become obvious
- Understand structural forces behind price movements
- Make more informed decisions about market direction and timing
Implementation success factors:
- Start with basic slope analysis before advancing to complex patterns
- Always use true delta zero and true gamma zero as part of broader analysis framework
- Focus on understanding structural implications rather than prediction
- Practice patience—these indicators work best over longer timeframes
Ready to add this powerful structural perspective to your trading toolkit? Understanding true delta zero and true gamma zero gives you insight into the forces that move markets—forces that traditional technical analysis simply can’t reveal.