Spotting Bearish to Bullish Shifts — The Ultimate How-To Guide
Introduction
Have you ever watched a sharp market decline finally start to reverse, only to hesitate on pulling the trigger because you weren’t confident the bearish to bullish shift was genuine?
Or worse—have you jumped into what looked like a bearish to bullish transition, only to get stopped out when the market resumed its downtrend?
You’re not alone. Identifying true bearish to bullish shifts is one of the most challenging aspects of trading, but also potentially the most profitable when done correctly.
At GammaEdge, we’ve developed a systematic framework to identify these critical bearish to bullish inflection points using our proprietary tools. Today, we’re sharing our exact methodology for spotting when markets transition from bearish to bullish market structure—and how you can learn to recognize these shifts to position yourself for significant profits.
Note: While this article provides a thorough overview of our framework for identifying bearish to bullish transitions, each tool deserves its own deep dive. We’ve linked to additional resources throughout for those wanting to better understand what each tool unlocks for your trading.
Table of Contents
Why Identifying Bearish to Bullish Shifts Matters for Your Trading
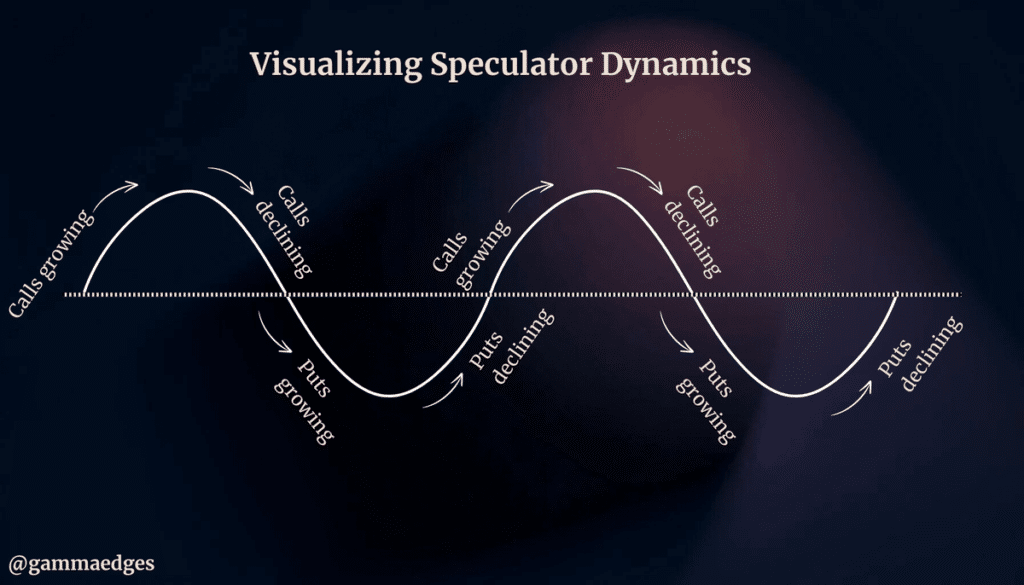
Markets don’t move in straight lines – they oscillate between periods of bullish and bearish control, and it’s this tug-of-war that creates the uptrends and downtrends in price action. Understanding where we are in this cycle gives you a tremendous edge when trading bearish to bullish reversals.
Think of these bearish to bullish transitions as a series of dominos falling in sequence, not a single event:
- First comes a shift in real-time buying pressure (reversing previous selling)
- Then changes in options positioning reflect changing sentiment
- Finally, price confirms the new uptrend
By tracking these dominos systematically, you can become adept at identifying bearish to bullish shifts and:
- Spot potential market reversals before they appear on price charts
- Confirm whether market behavior aligns with your bearish to bullish thesis
- Manage risk by identifying early when conditions change
- Position yourself ahead of the crowd, rather than chasing moves after they’re obvious
Let’s walk through our systematic approach for identifying bearish to bullish shifts—a framework that combines momentum analysis with options market positioning to give you a comprehensive view of market structure.
Framework Overview for Identifying Bearish to Bullish Shifts
Our framework for identifying bearish to bullish transitions is built on two foundational pillars:
1. Broad Market Momentum Analysis
This helps us understand when the trend shifts from selling to buying in real-time. In any bearish to bullish reversal, the first domino to fall is always a change in underlying buying and selling pressure. Before price charts confirm a transition from bearish to bullish, we can detect subtle shifts in the balance between buyers and sellers entering the market.
2. Options Market Positioning
Since options markets are inherently forward-looking and represent the bulk of speculator transactions in modern markets, monitoring how traders position themselves gives us insight into market expectations before they manifest in price. This provides critical early warning signs when identifying bearish to bullish shifts.
Our framework consists of four key components, which we’ll cover in detail:
- Market Trend Analysis: We first identify shifts in buying momentum using our Market Trend Model (MTM), looking for clear “linear up” days, which suggest shifts from selling to buying in the immediate term.
- Options Structure Evaluation: We then examine how options positioning is changing over time, focusing specifically on the balance between calls and puts speculation above and below current price levels.
- Transition Zone Monitoring: We pay close attention to whether price breaks through and holds above key structural levels within the options market structure we call “transition zones.”
- Supporting Indicators: Additional tools such as proprietary scans, the GEX Ratio, and True Delta/Gamma Zeros further evaluate the balance of call vs. put speculation in the options structure.
As we explore each component, you’ll understand not just what to look for when identifying bearish to bullish shifts, but also why each tool matters and how they work together as a cohesive framework.
The GammaEdge Framework for Identifying Bearish to Bullish Shifts
Step 1: Market Trend Model Analysis
The Market Trend Model (MTM) often gives us our first signal of changing market conditions when a bearish to bullish shift is occurring. This tool is built on the Tick Index, which measures real-time buying and selling activity “under the hood” of the market. When looking for a potential transition from bearish to bullish, we focus on four key elements:
The Cumulative Tick (CT) “Linear Up” Day
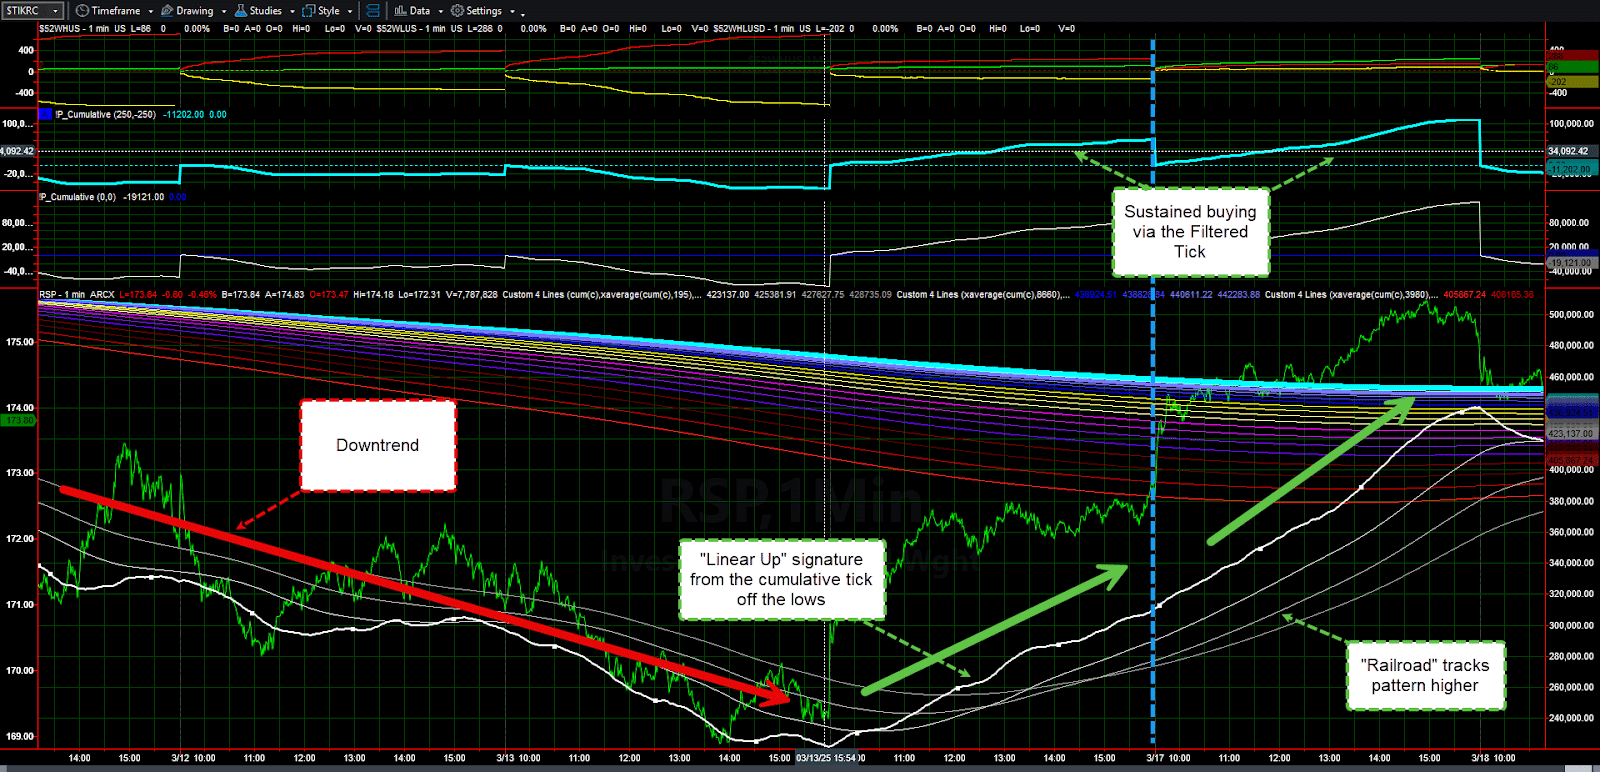
A “linear up” day occurs when the Cumulative Tick shows consistent upward momentum throughout a trading session (preceded by a prior downtrend), creating a clear 45-degree angle trajectory. This signals steady, persistent buying pressure throughout the day and most importantly, reverses the prior downtrend—a key signal in bearish to bullish transitions.
“Railroad Tracks” Formation Higher
After the initial buying surge via the “linear up” day, we next look for continuation of that buying through the trending higher of our short-term moving average ribbon. Specifically, we look for the “Railroad Tracks” signature to develop in an upward direction. When this signature develops, it confirms the initial buying impulse of the Linear Up Day.
Filtered Tick Confirmation
For additional confirmation of a bearish to bullish shift, we look for the Filtered Tick (FT) to show buying coinciding with the Linear Up Day. The Filtered Tick (bolded cyan line in charts) measures significant buying and selling pressure, so when it moves up in tandem with the CT, it signals that significant players are participating in the buying.
Sequential Confirmation
Remember that bearish to bullish transitions happen in stages, not as a single event. First comes the reversal from selling to buying pressure via the “linear up” day, followed by continuation that forms our bullish Railroad Track signature, all supported through significant buying entering the market as measured through our Filtered Tick. Not all “linear up” days lead to sustained rallies, but all meaningful bearish to bullish shifts begin with this exact signature.
Step 2: Options Market Structure Analysis in Bearish to Bullish Shifts
While the MTM shows us momentum shifts when identifying bearish to bullish transitions, we also need to understand if speculators are changing their positioning. This is where options market analysis becomes crucial.
Why focus on options? Because options markets are inherently forward-looking – speculators place bets on future outcomes. In today’s markets, a significant amount of speculation flows through options, making them a critical barometer of market sentiment when identifying bearish to bullish shifts.
NOTE: Don’t worry if you don’t trade options yourself – our framework makes this analysis straightforward.
Our options market analysis is focused on the SPX options market – given its size and liquidity, it’s an excellent way to measure the pulse of the general market when identifying bearish to bullish transitions.
For our framework, we focus specifically on the presence of calls and puts in the complex. During periods of downtrends, we see put speculators come to dominate the market structure; therefore, when the market starts to potentially make its bearish to bullish turn higher, this takes the form of put speculators leaving the complex and call speculators starting to flood in, overtaking put speculators who were previously dominating the structure.
To understand this shifting balance when identifying bearish to bullish transitions, we disaggregate the options market into two separate components:
- Left-hand plane (below spot price)
- Right-hand plane (above spot price)
Left-Hand Plane Analysis (Below Spot Price)
The Left-Hand Plane (LHP) represents all strikes below the current spot price. Here, we’re watching for In-The-Money (ITM) calls to start overtaking Out-of-The-Money (OTM) put speculators. The key point to understand when this happens is that put speculators are closing their positions (no longer willing to commit capital to further downside bets) and their influence within the complex is diminishing—a critical signal in bearish to bullish transitions.
We track this shift using two key tools:
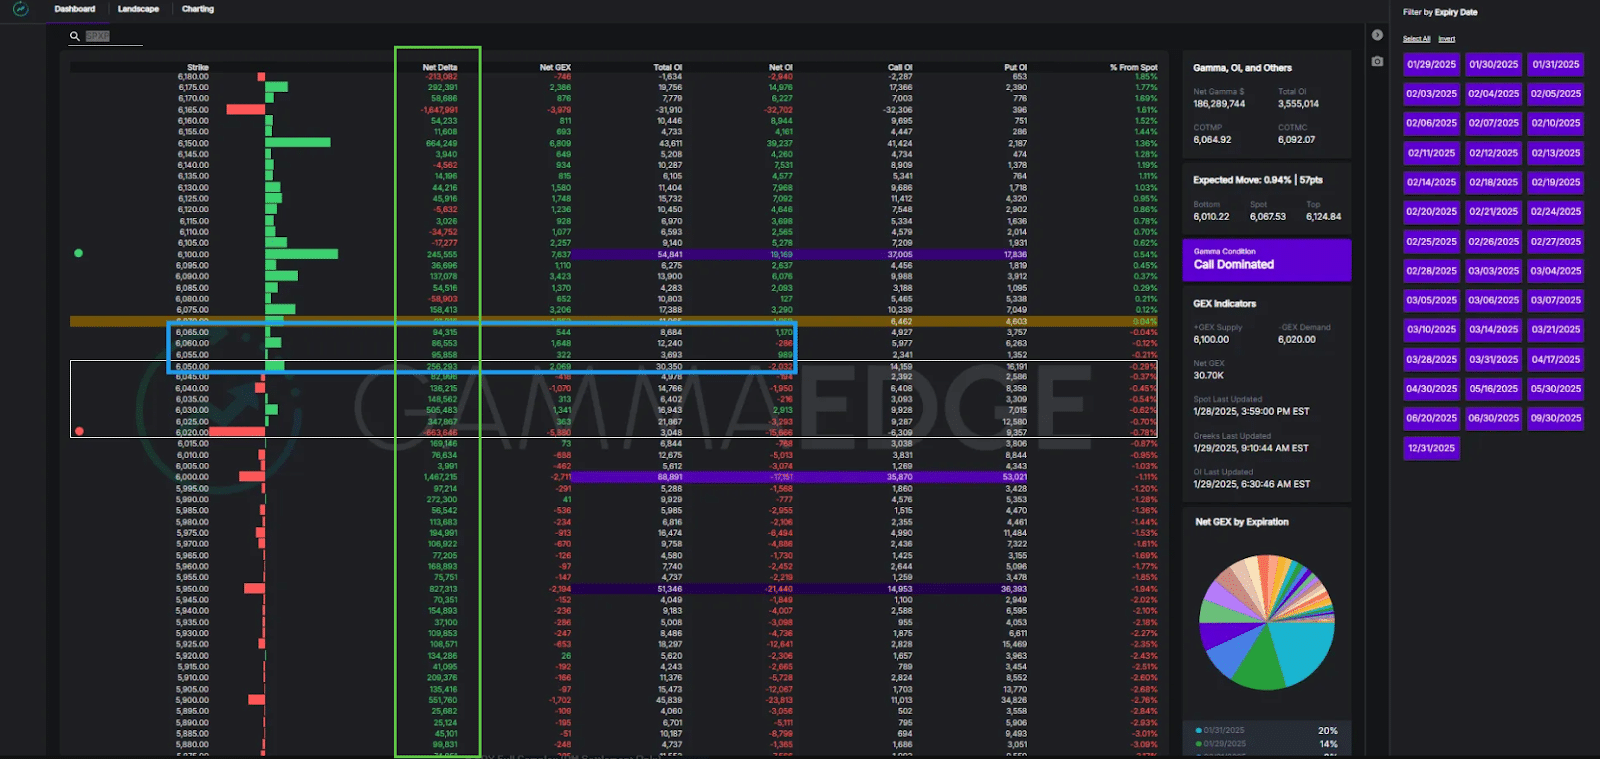
Web App Dashboard
This tool provides a visualization of the options structure and how speculators are positioned. We leverage the “Net Delta” column, which shows the difference between call and put delta in the complex. We use this visualization to watch for when green strikes (call-dominated) start overtaking red strikes (put-dominated) below spot price. This transition signals that ITM calls are starting to dominate and OTM puts are drying up.
For example, during a bearish phase, you’ll see put-dominated strikes (red) throughout the structure. As bearish to bullish shifts develop, green (call-dominated) strikes begin appearing, particularly below spot price first.
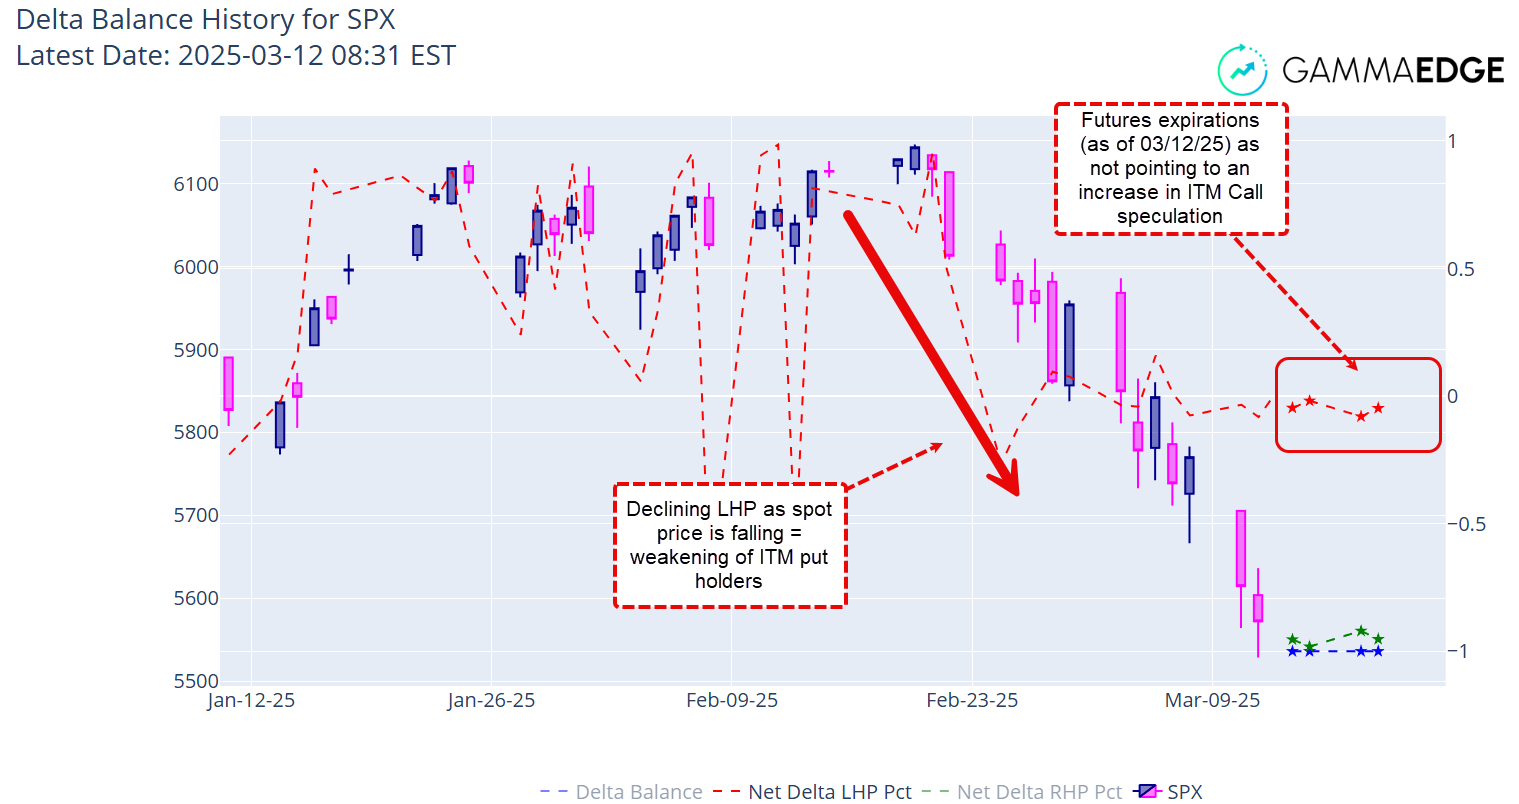
Delta Balance Command
The Delta Balance is another way we visualize who’s winning the battle above and below spot price – above 0 indicates calls are in control and below 0 indicates puts are in control. A bearish to bullish turn often begins when the LHP line shows two key characteristics:
- A positive slope trending higher
- A cross from below 0 to above 0
When this happens, ITM call holders are overtaking OTM put speculators, signaling that call dominance is entering (and put influence is leaving) below spot price—a key signal in bearish to bullish transitions.
Right-Hand Plane Analysis (Above Spot Price)
Similar to what was discussed for the LHP, the same approach applies to the Right-Hand Plane (RHP) – all strikes above spot price. Specifically, when identifying bearish to bullish shifts, we want to see:
- In-The-Money put holders leaving the complex
- Out-of-The-Money call speculators entering
This combination indicates a growing appetite for upside exposure while bearish positioning decreases—another critical signal in bearish to bullish transitions.
Remember: In a market transitioning from bearish to bullish, the first part of the structure to change is typically the removal of OTM put speculators below spot price, followed by OTM call speculators replacing ITM put holders above spot price.
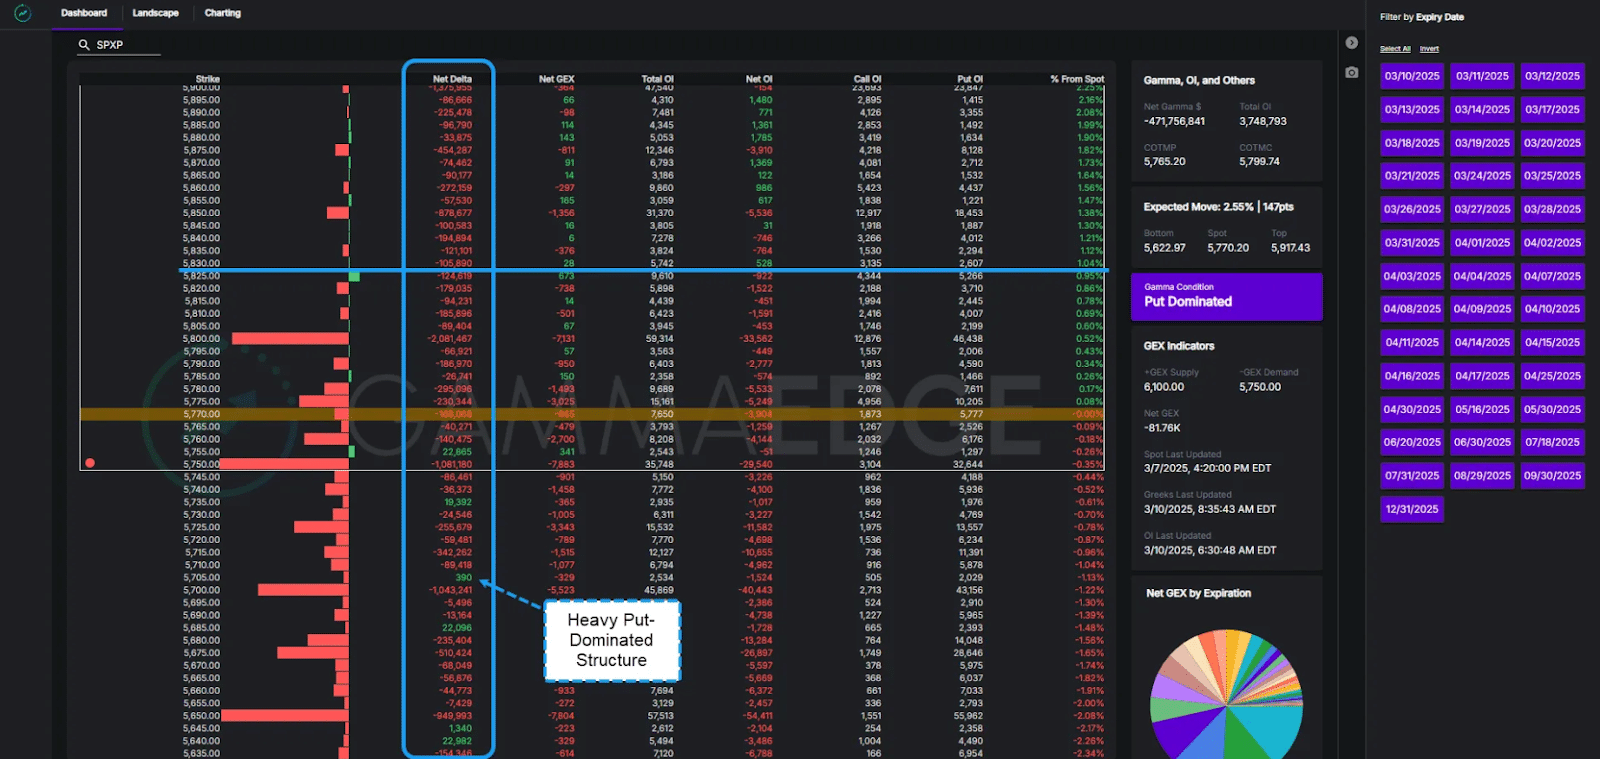
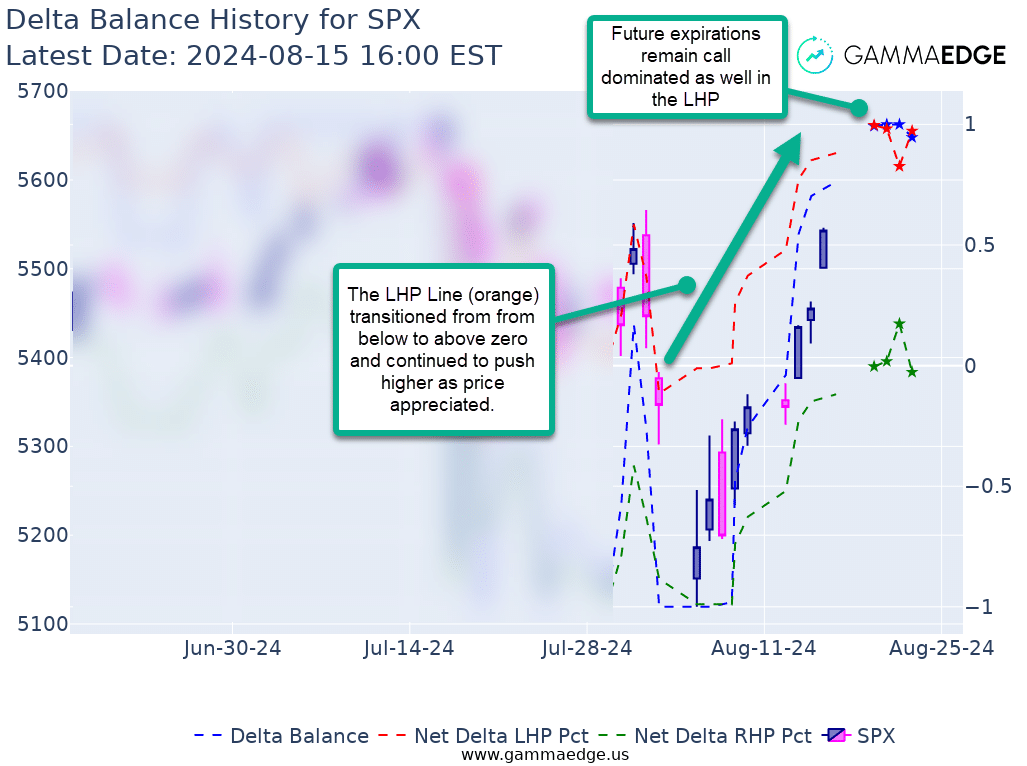
The second visual below demonstrates what a bearish-to-bullish transition looks like. In early August 2024, the LHP line (orange) flipped from trending lower to trending higher (crossing above 0), indicating calls were entering and puts were leaving the complex below spot price. This positive trend continued in subsequent weeks as price advanced. This is exactly the action we want to see – that is, the initial shift from bearish to bullish and then the follow through.
Understanding Different SPX Contracts When Identifying Bearish to Bullish Shifts
The SPX options market is a major component of our framework. We separate our SPX analysis into two distinct components – AM and PM settled contracts – because different types of traders transact within the two complexes:
- SPXP (PM-settled contracts) includes all expirations except the monthly and quarterly. These daily/weekly contracts, particularly 0DTEs, are dominated by short-term traders and active speculators. SPXP signals typically emerge first in bearish to bullish transitions, like a speedboat that can change direction rapidly.
- SPXA (AM-settled contracts) covers monthly and quarterly expirations primarily used by institutions for longer-term positioning. Think of SPXA as a super-tanker—slower to change course but representing significant institutional commitment when it does.
A true bearish to bullish transition typically shows SPXP changes first, followed by alignment in SPXA structure—when both “vessels” are heading in the same direction, the odds of a sustained market uptrend increase significantly.
Step 3: Transition Zone Analysis in Bearish to Bullish Shifts
The third key component of our framework is monitoring whether spot price crosses above (and holds) key transition zones identified within the options structure. These transition zones represent critical areas where control shifts between call and put speculators.
Think of transition zones as the market’s “neutral territory” – areas where neither bulls nor bears have clear control. Inside these zones, you’ll see call and put dominance constantly shifting back and forth, resulting in choppy, directionless price action.
What makes these zones so powerful for identifying bearish to bullish shifts is what happens when price breaks out of them. When spot price moves decisively above the top of a transition zone, it enters territory clearly dominated by call speculators—a strong signal that a bearish to bullish transition is underway.
For our framework for identifying bearish to bullish shifts, we track two specific types of transition zones:
- DEX Transition Zone: Based on net open interest (the distribution and balance between calls and puts at each strike)
- GEX Transition Zone: Based on gamma exposure (how rapidly options positions change in value)
When these transition zones align—meaning their upper and lower boundaries are at similar price levels—it creates an especially powerful signal for identifying bearish to bullish shifts.
In a market transitioning from bearish to bullish, we typically watch for this sequence:
- Spot price breaks through the top of the 0DTE (zero days to expiration) transition zone
- Then it breaks through the top of the full complex transition zone (when all expirations are included)
For a sustained market rally following a bearish to bullish shift, seeing price hold above the full complex transition zone is crucial. Also pay attention to the zone’s width:
- A wider zone indicates uncertainty and potential volatility
- A narrower zone suggests a well-defined market structure—ideal for a bullish case
When spot price breaks above these transition zones and call dominance is clear throughout the options structure, we have strong confirmation that the bearish to bullish shift is genuine rather than just a temporary bounce.
Step 4: Additional Tools for Spotting Market Tops
While our core framework provides a solid foundation for identifying bearish to bullish shifts, these additional tools offer valuable confirmation signals and deeper insights:
Breadth Analysis Through Proprietary Scans
Our proprietary scans help identify broader market shifts by tracking the number of stocks showing bullish vs. bearish characteristics:
- $calldomdel: Shows stocks dominated by calls above and below spot price
- $ncalldomdel: Shows stocks newly dominated by calls above and below spot price
During bearish to bullish transitions, watch for expansion in the number of call-dominated stocks day over day. This breadth confirmation indicates the reversal isn’t limited to a few names but represents a broader market shift from bearish to bullish.
Pro-tip: Stocks appearing on these scans should be monitored closely as they already display put dominance—making them prime candidates for potential short trades or protective strategies.
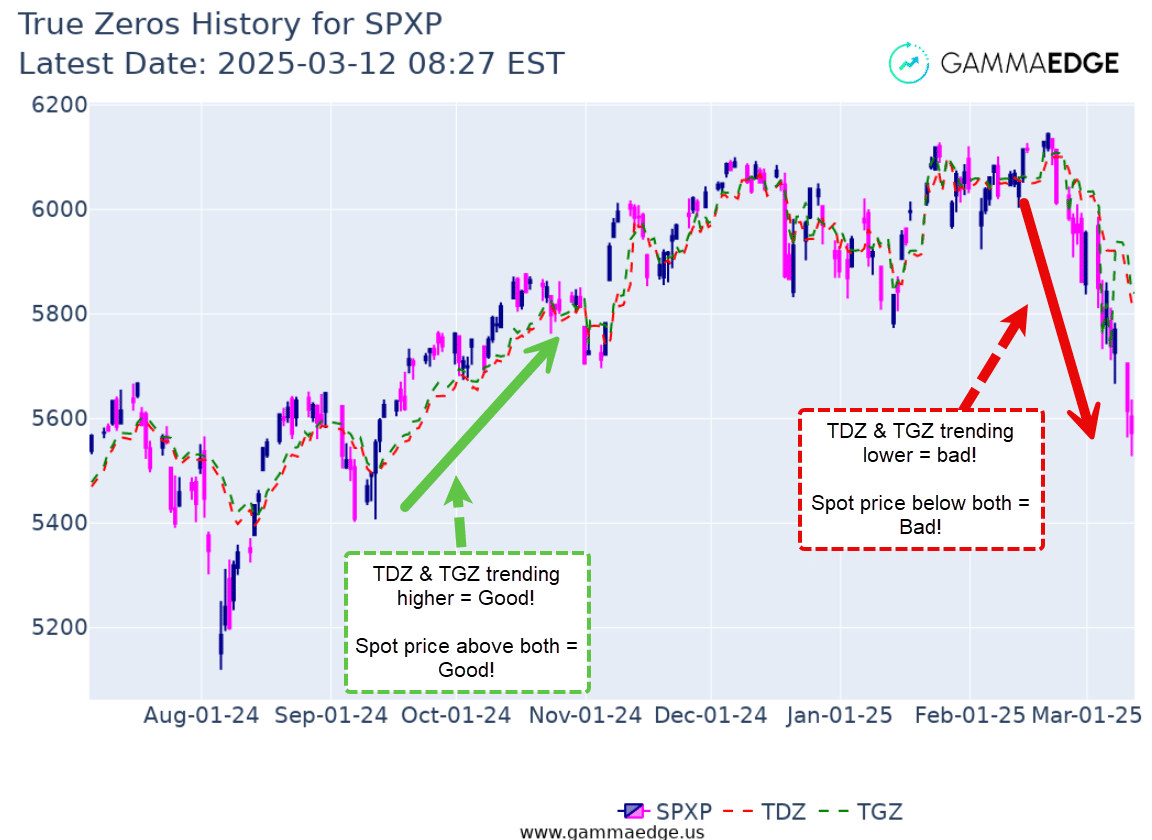
True Zeros for Identifying Bearish to Bullish Shifts
True Delta Zero (TDZ) is a theoretical balance point of an options complex where put delta and call delta are balanced. It’s not price-sensitive and may better indicate where average dealer delta levels transition from net positive to net negative exposure (and vice versa). When we start to see this metric shift from a downtrend to an uptrend, it’s suggestive of calls starting to increase their influence within the options complex—exactly what we want to see during bearish to bullish transitions.
True Gamma Zero (TGZ) represents the theoretical balance point where put gamma and call gamma are exactly balanced. Like TDZ, it’s not price-sensitive and helps indicate transitions in dealer gamma exposure. Again, we want to see this line trending higher during bearish to bullish shifts.
Remember to analyze TDZ and TGZ separately for both SPXP and SPXA contracts for a comprehensive view of short-term and institutional positioning during bearish to bullish transitions.
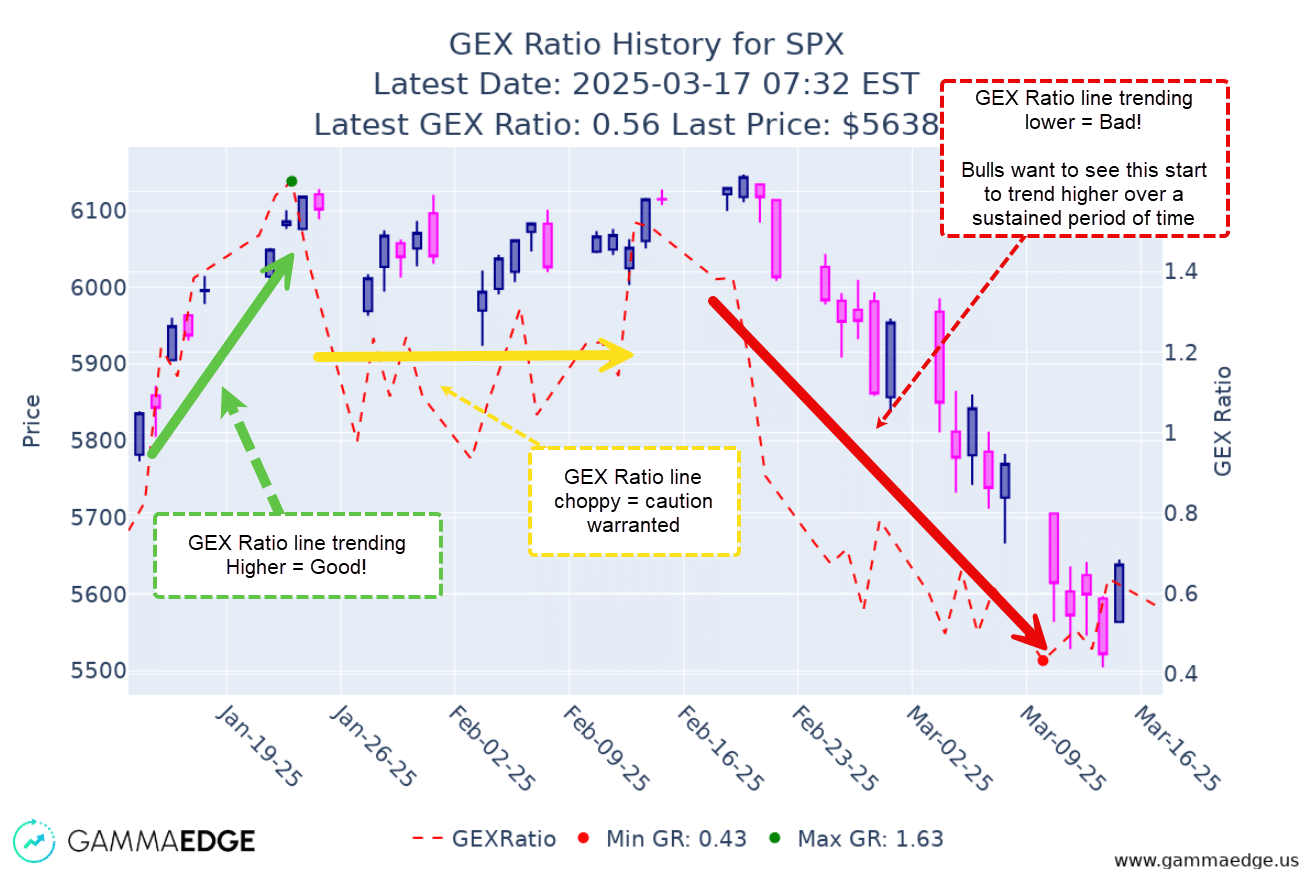
GEX Ratio Analysis for Bearish to Bullish Confirmation
This ratio measures total call gamma relative to put gamma across the options complex. Unlike the traditional put/call ratio, the GEX Ratio incorporates TIME through gamma, making it a superior sentiment indicator when identifying bearish to bullish shifts.
When this ratio trends higher, it signals that incremental call speculation is outpacing put speculation—a key confirmation in bearish to bullish transitions. Pay attention to:
- The ratio’s absolute level (above 1 = calls dominating)
- The direction of the trend (rising = increasing bullish sentiment)
- The rate of change (steeper positive slope = stronger shift in sentiment)
Each of these tools provides a different perspective on market structure during bearish to bullish shifts, helping you build conviction in your market view before committing capital.
Putting It All Together: Successfully Identifying Bearish to Bullish Shifts
The power of this framework lies in confirmation across multiple tools. No single indicator is sufficient for identifying bearish to bullish shifts, but when several align, the probability of a genuine market reversal increases significantly.
Remember that these signals appear in sequence, not simultaneously:
- First, we typically see changes in intraday momentum via the Market Trend Model
- Then, options market structure begins shifting as put speculators exit and call speculators enter
- Finally, price breaks above key technical levels (our transition zones) and holds them
Practical Application: Checklist for Identifying Bearish to Bullish Shifts
To implement this framework in your own trading, follow these steps:
1. Monitor the Market Trend Model daily
- Look for “linear up days” following downtrends
- Confirm with short-term moving averages forming the Railroad Tracks pattern trending higher
- Verify institutional participation via Filtered Tick buying
2. Track options structure changes
- Use our Web App Dashboard to monitor call vs. put dominance
- Check the Delta Balance command for shifts in the LHP and RHP lines
- Watch for transition from red to green strikes across the structure
3. Identify key transition zones
- Note where the GEX and DEX transition zones align
- Watch for price breaks above these zones
- Confirm price holds above these levels on subsequent sessions
4. Seek additional confirmation
- Run breadth scans to track expanding call dominance
- Monitor the GEX Ratio for uptrends
- Check TDZ and TGZ lines for upward momentum
Start by focusing on the core three-step framework before adding the supplemental tools. As you become more familiar with the process, you’ll develop an intuitive sense for identifying bearish to bullish shifts using these indicators in concert.
Final Thoughts on Identifying Bearish to Bullish Shifts
Successfully identifying bearish to bullish shifts represents some of the most profitable trading opportunities, but it’s also among the most challenging skills to master. By combining momentum analysis with options market structure, our framework gives you a systematic way to spot these transitions before they become obvious on price charts.
Remember that no framework is perfect—markets can always surprise us. However, by focusing on the sequence of signals (momentum shift → sentiment shift → structural confirmation), you’ll position yourself to identify bearish to bullish shifts more consistently than relying on price action alone.
Ready to learn more about identifying bearish to bullish transitions with precision? Our comprehensive GammaEdge Framework reveals our complete methodology so you can start spotting these critical inflection points for yourself.
Note: The examples shown in this article are from past dates and don’t reflect current market conditions. Be sure to run these commands yourself to get the most up-to-date and accurate information for your trading decisions. And if you’d like a video walkthrough of the above, click here.