Market Makers: The Unseen Engine Of Modern Options Markets
Market makers are the invisible engines powering every trade you make, yet most traders have no idea how they operate or why understanding them is crucial for trading success. If you’ve ever wondered why you can instantly buy or sell almost any stock or option, or why certain price levels seem to act like magnets, the answer lies with these behind-the-scenes players.
In this lesson, we’ll demystify Market Makers—not to turn you into a market structure expert, but to show you how understanding their role enhances your ability to use the GammaEdge Framework effectively. Because while Market Makers don’t drive markets, their hedging behavior creates predictable patterns we can capitalize on.

Table of Contents
What Are Market Makers?
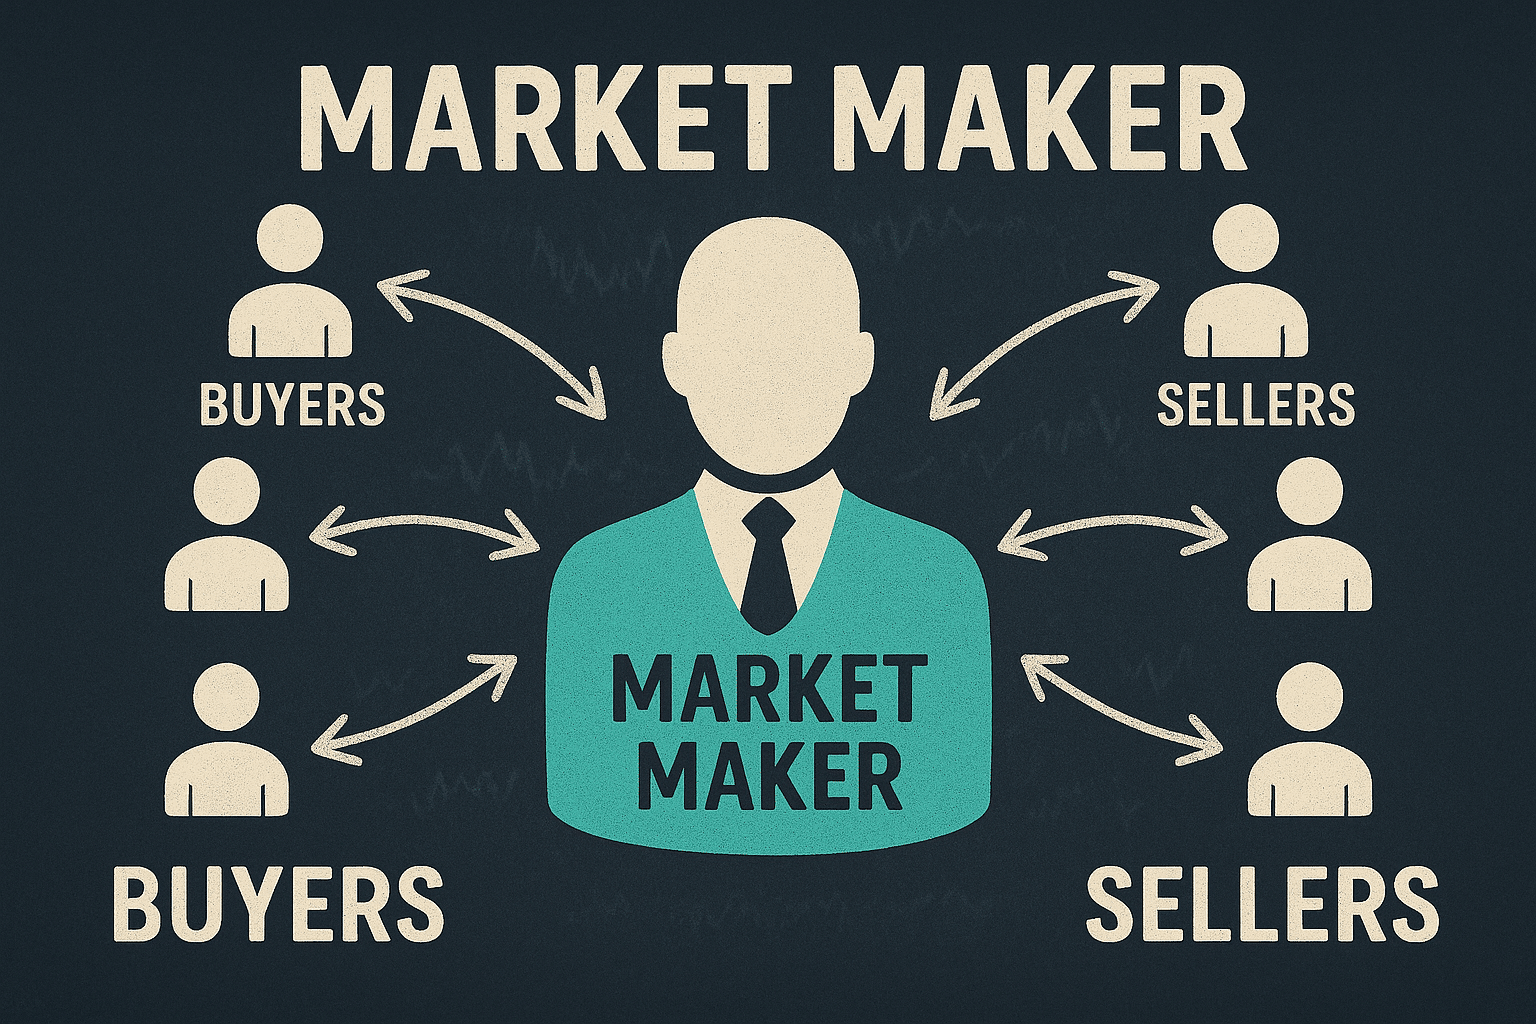
Market makers are financial firms that provide liquidity to markets by continuously quoting both bid and ask prices for securities. Think of them as the market’s essential infrastructure—the plumbing that allows millions of daily transactions to occur smoothly and instantly.
When you place a trade through your broker, there’s often no other retail trader immediately available to take the opposite side. Market makers fill this gap by standing ready to buy when you want to sell, and sell when you want to buy, ensuring markets remain liquid and functional.
The Biggest Market Makers
The market making landscape is dominated by several major firms:
- Citadel Securities – One of the largest market makers in equities and options
- Virtu Financial – A leading electronic market maker across multiple asset classes
- Susquehanna International Group (SIG) – Major player in options market making
- Wolverine Trading – Prominent derivatives market maker
- Jane Street – Quantitative trading firm with significant market making operations
These aren’t small operations—they’re massive, technologically sophisticated firms handling billions of dollars in daily transactions
How Do Market Makers Make Money?
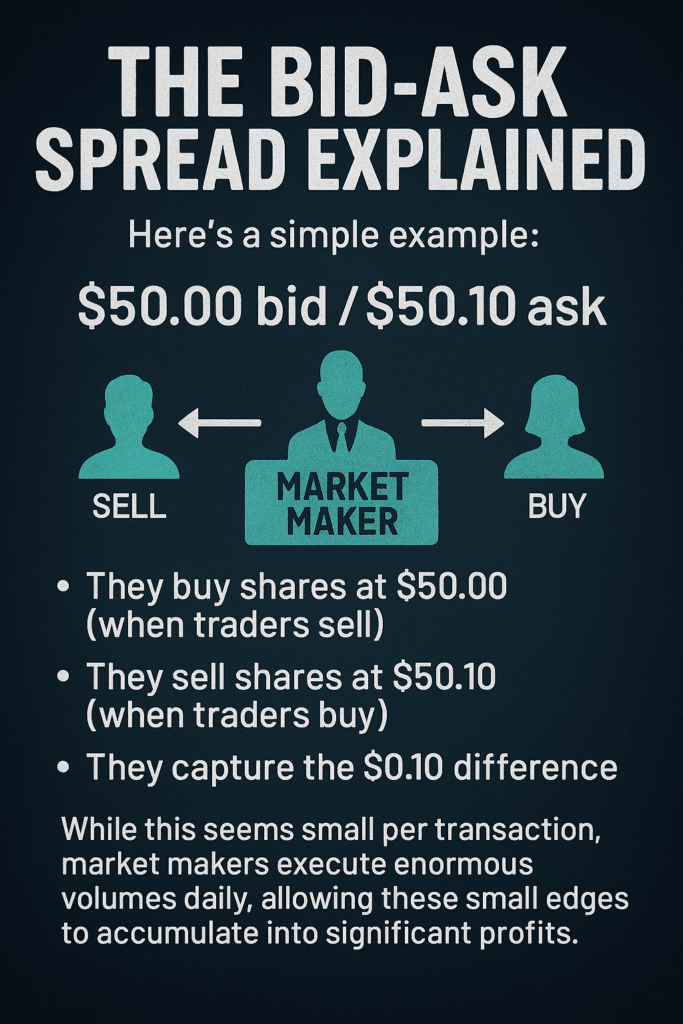
Unlike most traders who bet on price direction, market makers operate on an entirely different profit model. Their primary revenue source is the bid-ask spread—the difference between the price they’re willing to buy (bid) and sell (ask) a security.
The Bid-Ask Spread Explained
As market makers facilitate trades, they naturally accumulate positions in various securities. This creates a fundamental problem: they’re not in the business of making directional bets on whether stocks go up or down. Their model depends on staying relatively neutral while capturing spreads.
To maintain neutrality, market makers must constantly hedge their positions—and this hedging activity has profound effects on market prices.
What Do Market Makers Do? The Hedging Process
Here’s a simple example:
- Market maker quotes: $50.00 bid / $50.10 ask
- They buy shares at $50.00 (when traders sell)
- They sell shares at $50.10 (when traders buy)
- They capture the $0.10 difference
While this seems small per transaction, market makers execute enormous volumes daily, allowing these small edges to accumulate into significant profits.
As market makers facilitate trades, they naturally accumulate positions in various securities. This creates a fundamental problem: they’re not in the business of making directional bets on whether stocks go up or down. Their model depends on staying relatively neutral while capturing spreads.
To maintain neutrality, market makers must constantly hedge their positions—and this hedging activity has profound effects on market prices.
Delta Hedging in Action
Let’s walk through a real example:
- You buy a call option – This gives you positive exposure to upward price movement
- Market maker sells you the call – They now have negative exposure (they lose if price rises)
- Market maker hedges – They buy the underlying stock to offset their negative exposure
- Net result – Market maker is neutral, but their hedging created buying pressure
Now imagine this process across the entire options market—millions of contracts daily, with market makers on the other side of many trades. When market makers collectively become significantly long or short, their hedging can dramatically impact underlying asset prices.
The Greeks: Market Makers' Risk Dashboard
Market makers use sophisticated metrics called “the Greeks” to manage their risk:
Delta (Δ): Measures sensitivity to price changes
- Call options have positive delta (0 to 1)
- Put options have negative delta (-1 to 0)
- Market makers aim to stay “delta neutral”
Gamma (Γ): Measures how delta changes as price moves
- Highest for at-the-money options near expiration
- Creates the need for constant hedge adjustments
- Source of explosive moves during “gamma squeezes”
How Market Makers Impact Your Trading
Understanding market maker behavior provides crucial context for interpreting price action and market structure. Their activities create predictable patterns that savvy traders can capitalize on.
Positive vs. Negative Gamma Environments
Market makers’ collective positioning creates different market regimes:
Positive Gamma Environment:
- Market makers are long gamma (typically from selling options to customers)
- Forced to “buy low, sell high” for hedging
- Creates range-bound, lower volatility conditions
- Price tends to gravitate toward high-option-volume strikes
Negative Gamma Environment:
- Market makers are short gamma (customers are net buyers of options)
- Forced to “sell low, buy high” for hedging
- Amplifies volatility and trends
- Can create explosive moves in either direction
The "Tail Wagging the Dog" Effect
This describes situations where the relatively smaller options market influences the much larger stock market. The most dramatic example is a gamma squeeze:
- Heavy call buying forces market makers short gamma
- Market makers must buy stocks to hedge their call exposure
- Stock buying pushes prices higher
- Higher prices make calls more valuable, attracting more buyers
- More call buying forces more stock buying by market makers
- Cycle continues, creating explosive upward moves
The rise of zero-days-to-expiration (0DTE) options has significantly amplified these dynamics, as gamma reaches peak levels near expiration.
Market Maker vs. Dealer: Understanding the Difference
While often used interchangeably, there are subtle distinctions:
Market Makers:
- Provide liquidity by quoting continuous bid/ask prices
- Act as principals (trade for their own account)
- Focus on capturing bid-ask spreads
- Heavily regulated to ensure market stability
Dealers:
- Broader term that can include market makers
- May operate in different capacities (primary dealers, etc.)
- Can include firms that warehouse inventory for clients
Brokers (for comparison):
- Act as agents for clients
- Don’t take the other side of trades
- Profit from commissions and fees
- Connect buyers with sellers or market makers
Connecting MM Activity To The GammaEdge Framework
The actions of MM/Ds are not arbitrary but are a fundamental aspect of market operations, mandated by exchange regulations to ensure liquidity and stability. By understanding when and where MM/Ds are likely to buy or sell substantial stocks/futures to hedge their positions, traders can unlock a robust understanding of potential market movements.
Taking a quick step back, we (GammaEdge) view the market as a dynamic tug-of-war between call and put speculators, akin to a sine wave. This continuous battle between bulls and bears manifests in the options market through speculation, which informs positioning. By analyzing this positioning, we can better understand whether call speculators are gaining the upper hand over spot price or if put speculators exert more force below. This helps us anticipate where Market Makers must hedge and where the price might be pushed next.
Understanding market speculators’ behavior, which directly drives Market Maker hedging behavior, is the sole purpose of our three-pillar framework centered around Sentiment, Trend, and Structure. As noted in the foreword to this lesson, our methodology and tools translate speculators’ actions (and the resulting Market Maker responses) into actionable information we can use in our trading. When speculators position themselves, Market Makers react, and our framework helps you anticipate these reactions before they impact price.
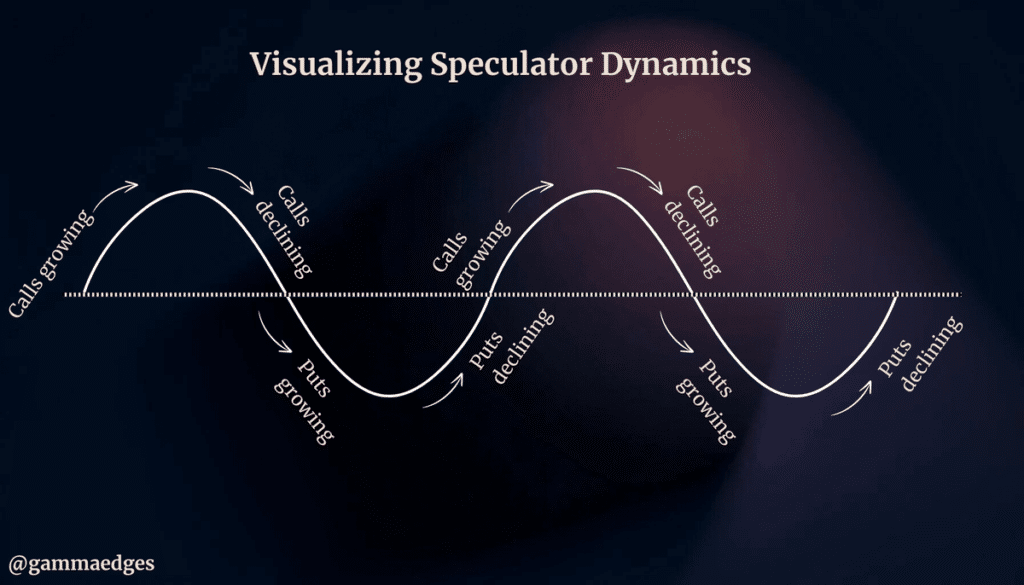
1) Sentiment
As noted above, markets move along a path similar to that of a sine wave — markets can either be completely call dominated, put dominated, or shifting somewhere in-between. This constant ebb and flow directly influences Market Maker positioning, as they must continuously adapt their hedging strategies to match the prevailing sentiment.
Understanding the “sentiment” of the market – essentially the balance of power between call and put speculators – enables you to more accurately gauge if the bulls or bears have the upper hand. This understanding is crucial because it helps predict how Market Makers will adjust their hedging, which in turn influences price direction. This knowledge ultimately helps with trader bias, trade selection, and trade execution (entries and exits).
This foundational knowledge is crucial as the purpose of the GammaEdge toolkit — to simplify the complex options markets such that you can easily interpret and act on these market dynamics in real-time.
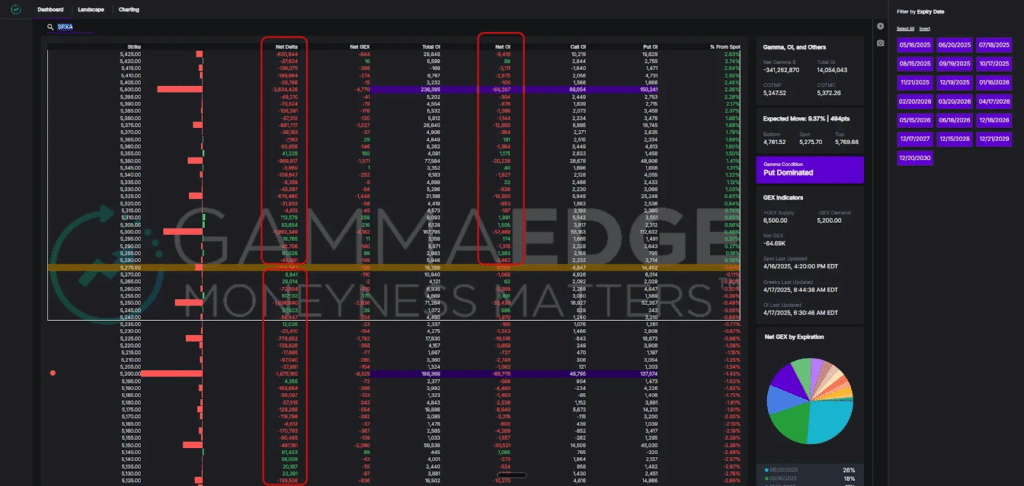
Using our Web App Dashboard, which is a visualization of the underlying options market (SPX in this case), here is an example of a call-dominated environment. In general, a call-dominated environment is the backbone of a bullish market structure. In this scenario, Market Makers are typically short calls (having sold them to bullish speculators) and must buy the underlying to hedge, creating supportive flows that aid price movement higher. This is an environment where MM hedging reinforces the upward trend, giving us reason to consider long positions in alignment with these structural forces.
NOTE: This lesson is a simplistic overview of our process and we understand that markets shift and are not static, which is why we have developed our Market Turning Framework. This framework helps us identify when markets are shifting from bullish (call dominated) to bearish (put dominated) and vice versa. You can review that lesson HERE.

And here is an example of a put-dominated environment, which is the signature of bearish and volatile market conditions. In this structure, Market Makers are typically short puts and must sell the underlying to hedge, accelerating downward moves. The key takeaway here is, if knowing this key information on market structure, would you try to force a trade to the upside, or would you be keen to trade more in line with how the market is currently positioned (i.e., short or sitting in cash)? Understanding these structural forces and their impact on MM hedging behavior will help shape your market bias and lead to better-informed trades.
Options market activity, which MM/Ds facilitate, offers quantifiable gauges of market sentiment. By analyzing the balance of call versus put activity and understanding how Market Makers must position themselves in response, we can assess not just the market’s mood but also anticipate the likely hedging flows that will follow.
2) Trend
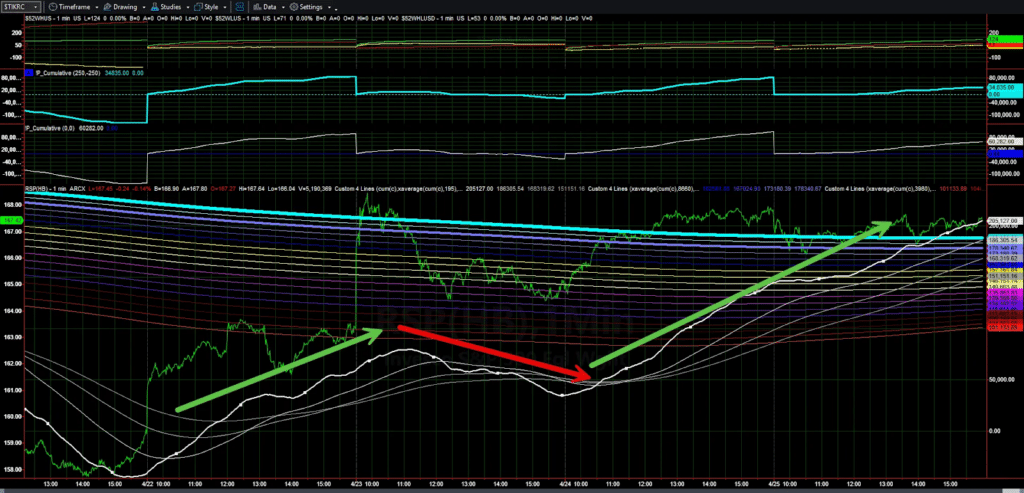
While our Market Trend Model operates independently of options market activity, it provides critical context for understanding how Market Maker behavior aligns with broader market momentum. The MTM tracks actual buying and selling pressure through the Cumulative Tick, giving us a real-time view of market momentum across multiple timeframes. This helps us anticipate when MM hedging will support or resist prevailing trends.
It’s important to understand that Market Maker flows aren’t the driving force behind market trends—they’re reactive mechanisms that tend to reinforce what’s already happening. When traders, institutions, and other participants are constructive about the market moving higher, MM/Ds adapt their positioning accordingly. Their hedging activities can amplify these moves, but don’t create them.
This is precisely why our three-pillar framework is so robust. By combining:
- Market structure shaped by MM positioning (tells us where hedging pressure exists)
- Sentiment reflected in options activity (shows us which side MMs are likely hedging)
- Trend captured by the Market Trend Model (reveals if MMs will be trading with or against momentum)
…we get a comprehensive view of what the market “by and large” is doing. When all three align—bullish MTM coinciding with call-dominated structure and positive sentiment—we have higher confidence that MM hedging flows will act as a tailwind rather than a headwind to price movement.
The key takeaway is that MM/Ds participate in a larger ecosystem. Their activities can certainly influence short-term price action through hedging flows, but they ultimately follow and adapt to the collective actions of all market participants. This is why looking for confluence across all three pillars gives us the most complete picture of market dynamics — and the Market Trend Model is one tool we’ve developed that helps us identify when these reinforcing dynamics are likely to occur.
For instance, when the Cumulative Tick and Railroad Tracks are properly stacked and trending in the same direction (like below) as the options structure, MM hedging flows are more likely to act as a tailwind than a headwind to price movement. In this aligned state, Market Makers are forced to hedge in the direction of the trend, creating self-reinforcing price action.
This connection between trend and structure is why we emphasize looking for confluence between the Market Trend Model and options positioning signals—it tells us when the technical trend and structural forces are working together, creating higher-probability trading opportunities.
NOTE: If you are unfamiliar with the Market Trend Model, we have a dedicated deep dive for you HERE.
3) Structure
Market structure refers to the underlying positioning within an options structure, as this positioning directly dictates where and how Market Makers must hedge their exposure. These structural elements have a significant influence on spot price movement because they determine when MM hedging will occur and at what magnitude.
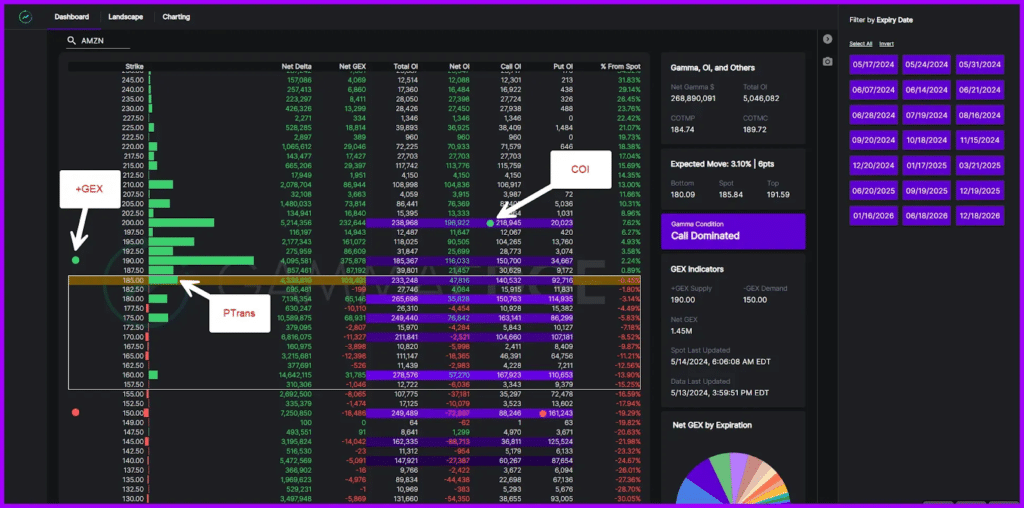
Large concentrations of delta and gamma (i.e., large positioning of options) at specific strike prices represent levels where significant MM hedging is likely to occur. These levels can act as magnets or “pins,” potentially containing price movement as MM/Ds hedge around those strikes. For example, if there’s a large gamma concentration at the 5000 strike in SPX, Market Makers will need to buy when price dips below 5000 and sell when it rises above, creating a gravitational effect. If these high-gamma levels are breached decisively, the resulting accelerated hedging can lead to sharp breakouts as MMs are forced to chase price.
At GammaEdge, we identify key levels in the options structure where MM hedging flows are most influential. These levels include:
- The DEX & GEX Transition Zone (bounded by PTrans and NTrans): The area where MM/Ds have minimal directional exposure, resulting in choppy, range-bound price action. In this zone, Market Makers are closest to neutral and have less need to hedge, allowing price to drift without structural reinforcement.
- Key Upside/Downside Targets (GEX and COI/POI): Levels where significant hedging activity occurs, often acting as profit-taking zones. These are areas where MM hedging pressure intensifies, potentially creating resistance or support as dealers adjust their positions.
Common Market Maker Misconceptions
"Market makers manipulate prices"
Market makers hedge to manage risk, not manipulate markets. Their activities are heavily regulated.
"Market makers always trade against retail"
“Market makers always trade against retail”
"Market maker flows drive markets"
peculation drives markets; market maker flows amplify existing trends but don’t create them.
"All market makers are the same"
Different firms specialize in different markets and have varying risk tolerances and strategies.
Conclusion: The MM Edge
Market makers are far more than passive facilitators—they’re integral components of the market’s operating system. Their continuous hedging activities directly influence underlying asset prices, shape market structure, and determine volatility regimes.
Understanding how market makers operate, make money, and manage risk provides invaluable context for any trader. Whether you’re day trading 0DTE options or swing trading stocks, market maker positioning affects your results.
The most successful traders recognize that market makers’ hedging creates predictable patterns and flows. By understanding these dynamics, you can position yourself to benefit from—rather than fight against—one of the market’s most powerful forces.
Remember: You don’t need to become a market structure expert to benefit from this knowledge. The key is recognizing how market maker behavior creates opportunities and using that insight to make better trading decisions.
The examples shown in this article are for educational purposes and don’t reflect current market conditions. Always conduct your own analysis before making trading decisions.